Objective:
- Existing studies tend not to address potential drawbacks of the 15-minute city model, including the risk of heightened socio-economic segregation as a possible consequence of an intensified focus on localized living
Case:
Methodology:
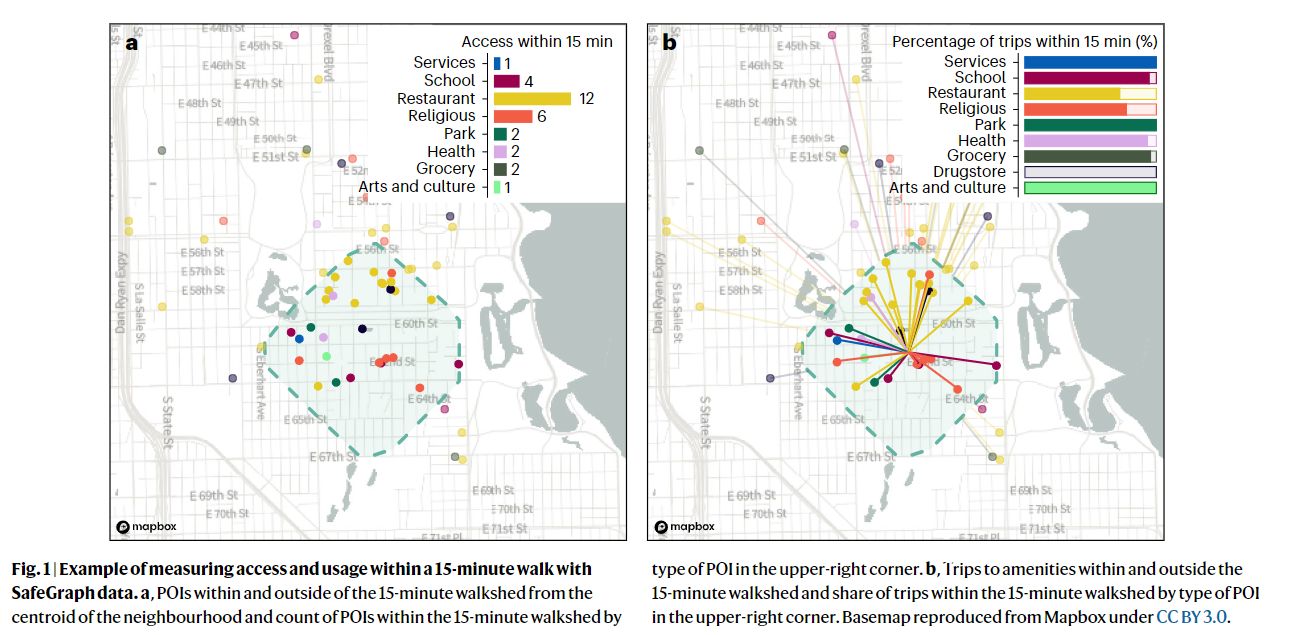
- 15-minute usage: the proportion of trips originating in each neighborhood that were aimed explicitly towards these essential amenities and occured within a 15-min walk from the neighborhood’s population-weighted centroid
- Robustness: subgroup
- IV
Data Source: Open
- Smartphone from SafeGraph
- Socialeconomic: American community survey
- Commuting length: Employment-household dynamics origin-destination employment statistics
- Public transit frequency: Environmental protection agency
- Historical data (IV): 1961 zoning handbook
- County business: 2019 census county business patterns
- Physical segregation index
- Experienced integration: $Int_{k_i,l} = \frac{\sum_{k_j} p_{k_j, L} * s_{k_i \rightarrow k_j}}{\sum_{k_j} p_{k_{j,L}}}$, $s_{k_i \rightarrow k_j} = |r_i-r_j |$
- Where $p_{k_j, L}$ is the number of people of income $k$ who visit $L$ and $r$ is the income rank
- Aggregated: $Int_j = \frac{\sum_{L \in POIs} Int_{k_j,l} \times p_{j,L}}{\sum_{L \in POIs}} p_{j,L}$
- $Segregation = 1 - Int_j$
Findings:
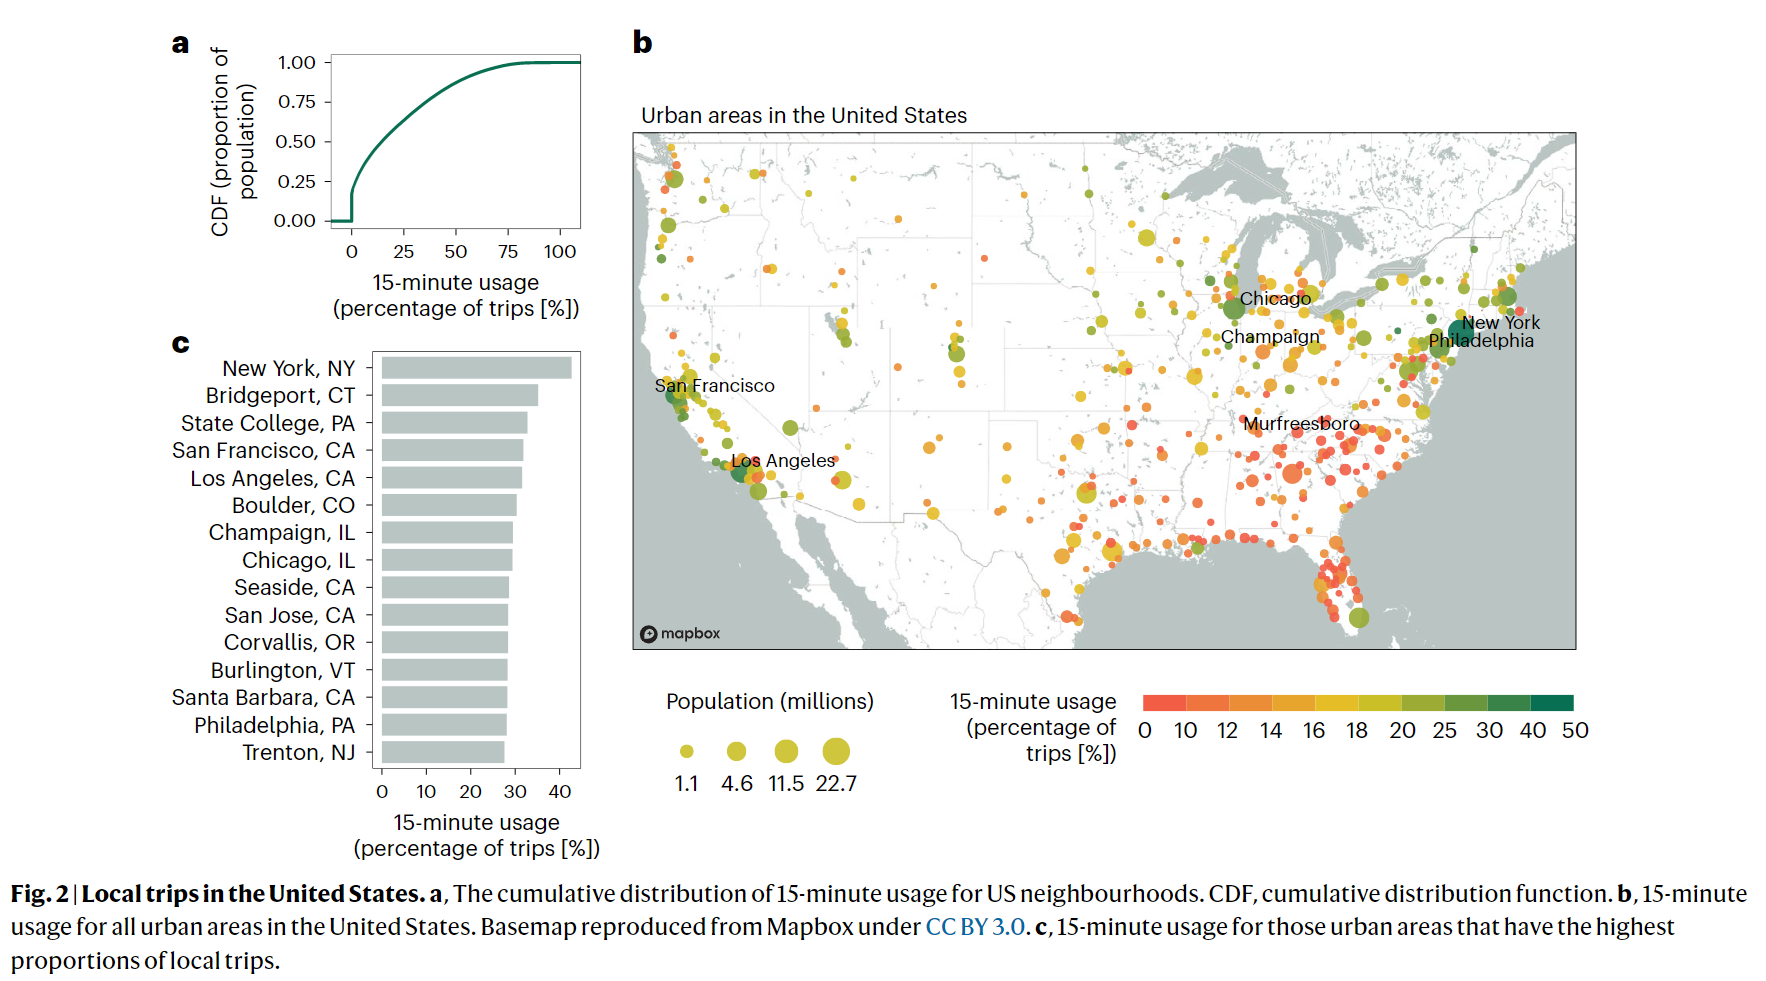
- Residents of the median US neighborhood take only 14% of the trips to basic amenities within a 15-min walking radius, 84% of US neighborhoods make less than half of their trips within a 15-min walking radius
- Regional diecrepancy
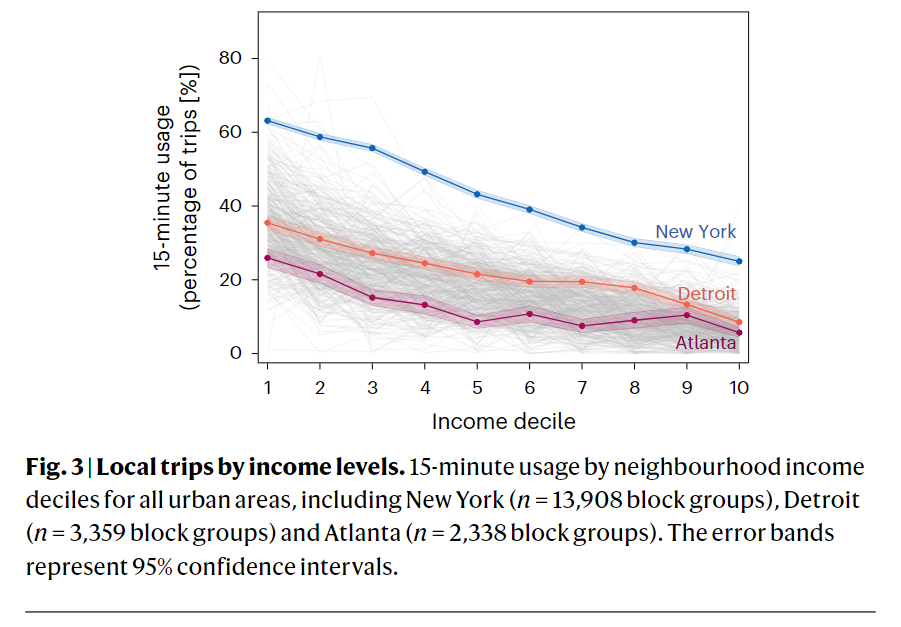
- 15-min usage decreases sharply with income. Residents in the bottom income decile make on average 41% of their trips within a 15-min radius, those in the top income decile make only 11% of their trips
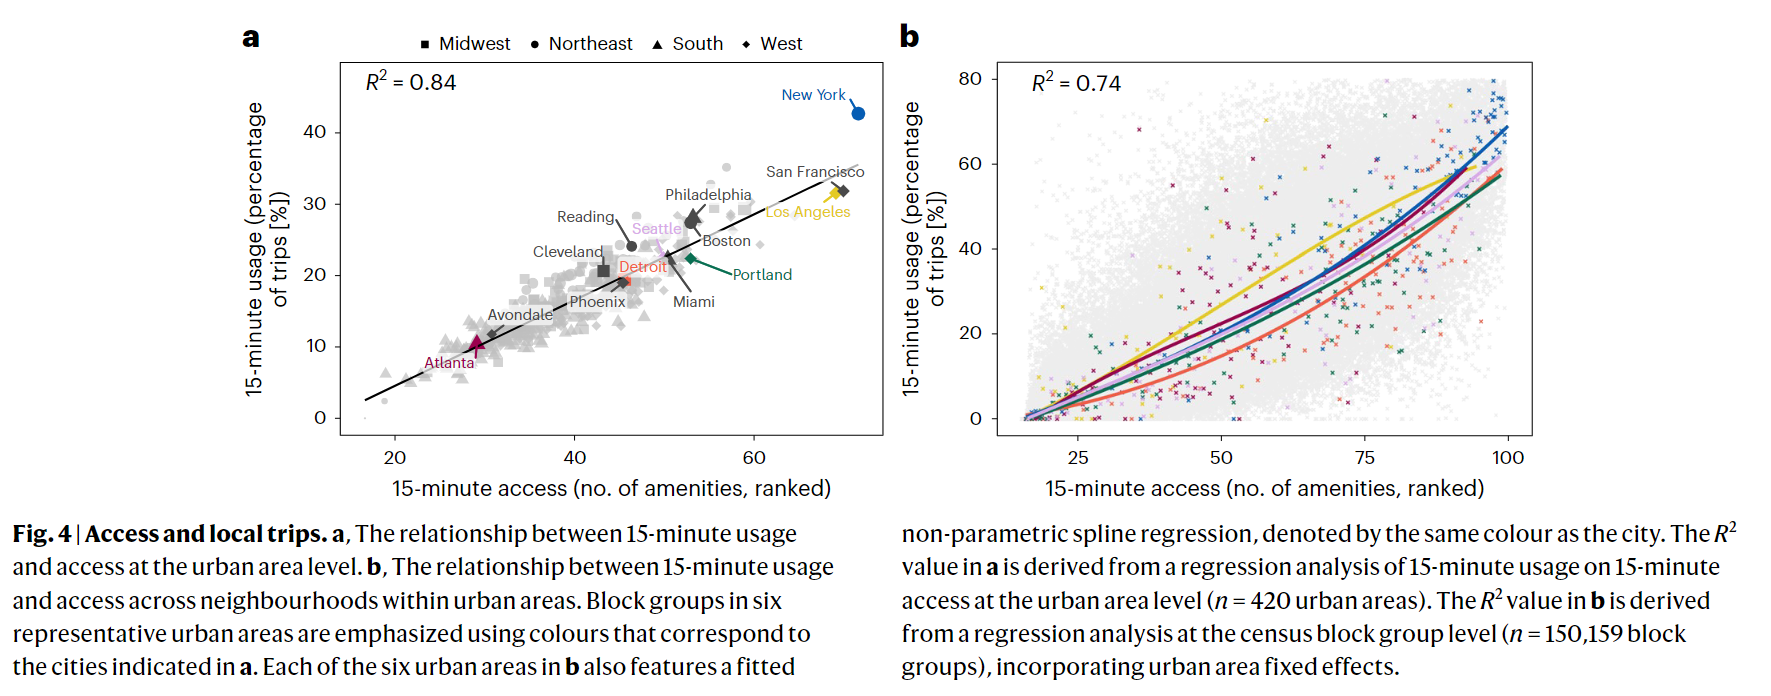
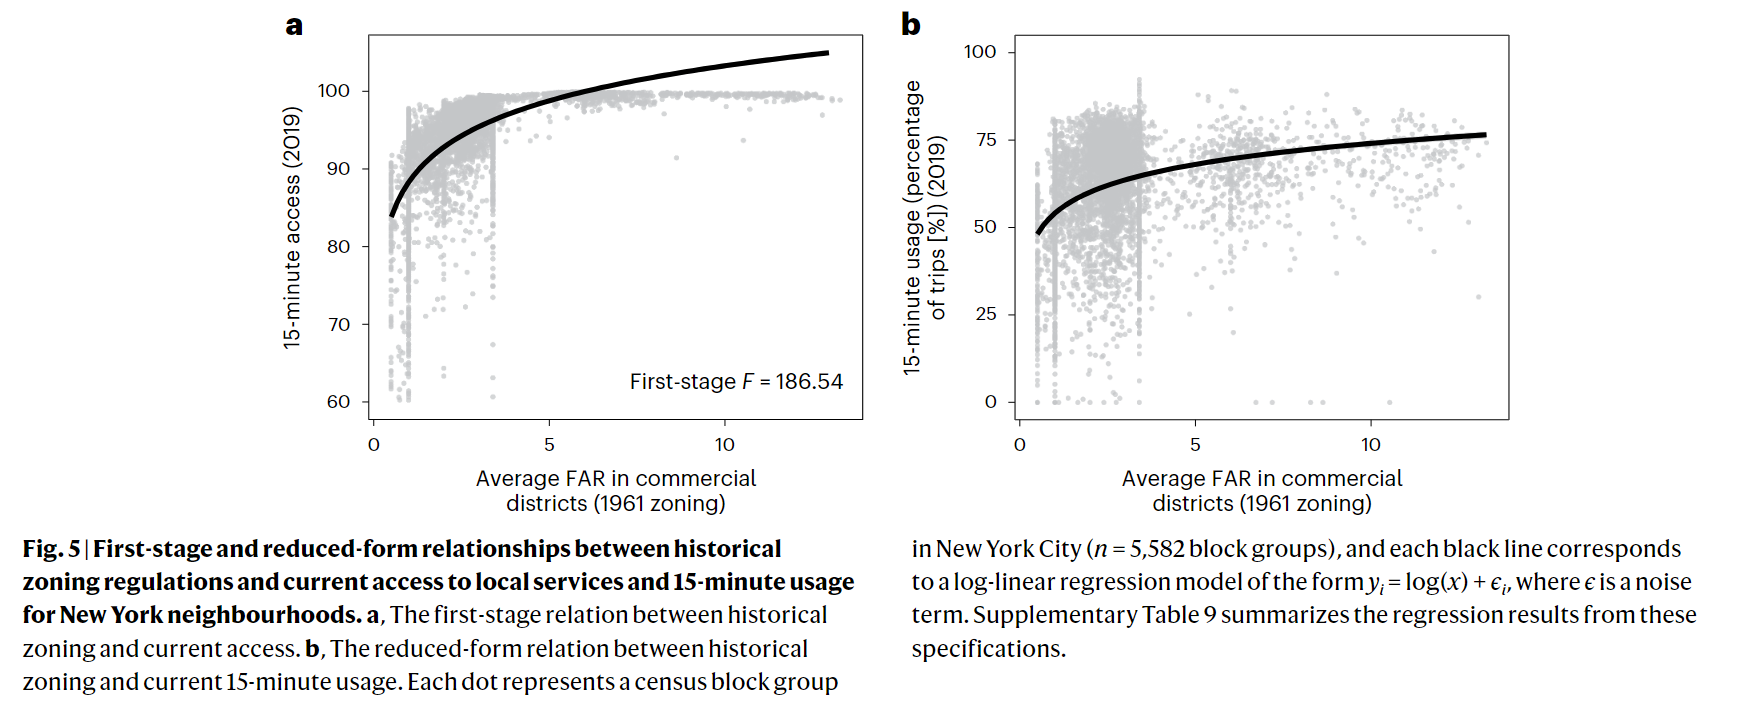
- Using population-weighted average aggrgated to the urban area level, 15-min access measure explains 84% of the variation in 15-min usage across urban areas
- 1% increase in access corresponds to a 0.77% increase in 15-min usage
- Positive factors of 15-min usage: population density, transit frequency, proximity between homes and workplaces
- Negative: income
- restrictions on land use contribute to extended travel distance and increased carbon emissions
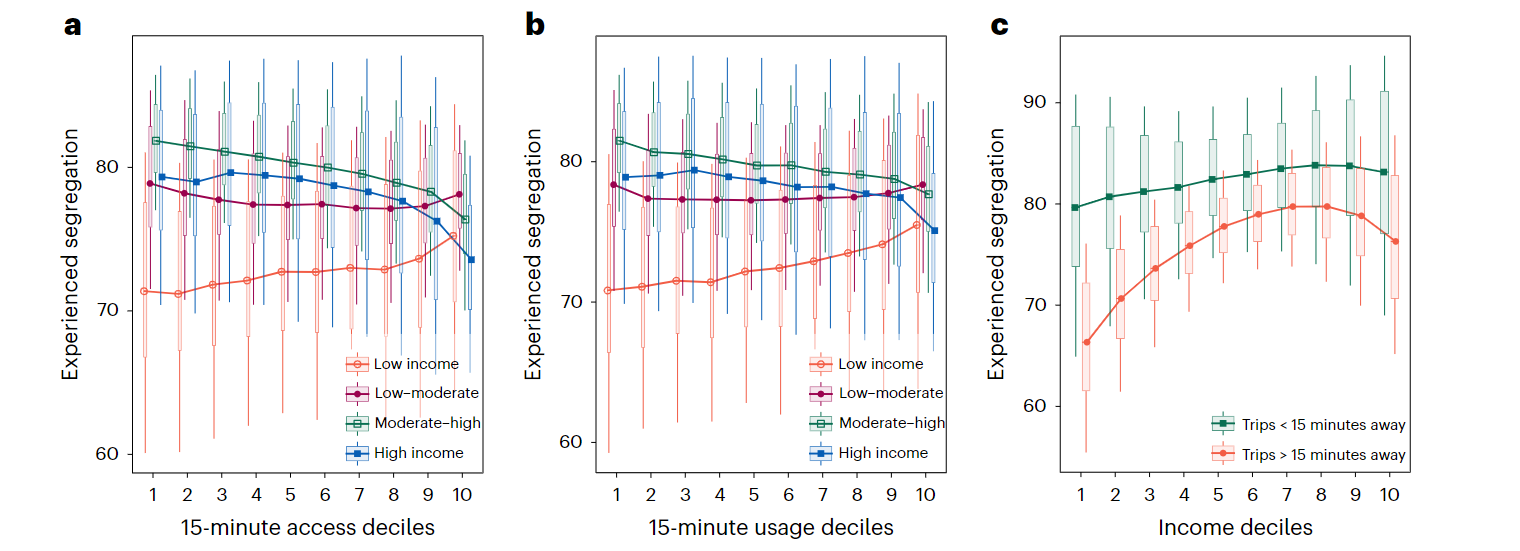
- A negative association between 15-min usage and experienced segregation for residents of upper-middle and high-income neighborhoods
- The positive association between the percentage of 15-min trips and our segregation index for residents of less affluent neighborhoods indicates that these individuals are more likely to interact with a socio-economically diverse group during longer trips than during shorter ones
Coding Reference:
