Objective:
- Study the substitution rebound effect in US freight transportation sector
Case:
Methodology:
- Multinomial logit model
- Cost function
Data Source
- US CFS-PUF
- Monthly average price
- Fuel price
Findings:
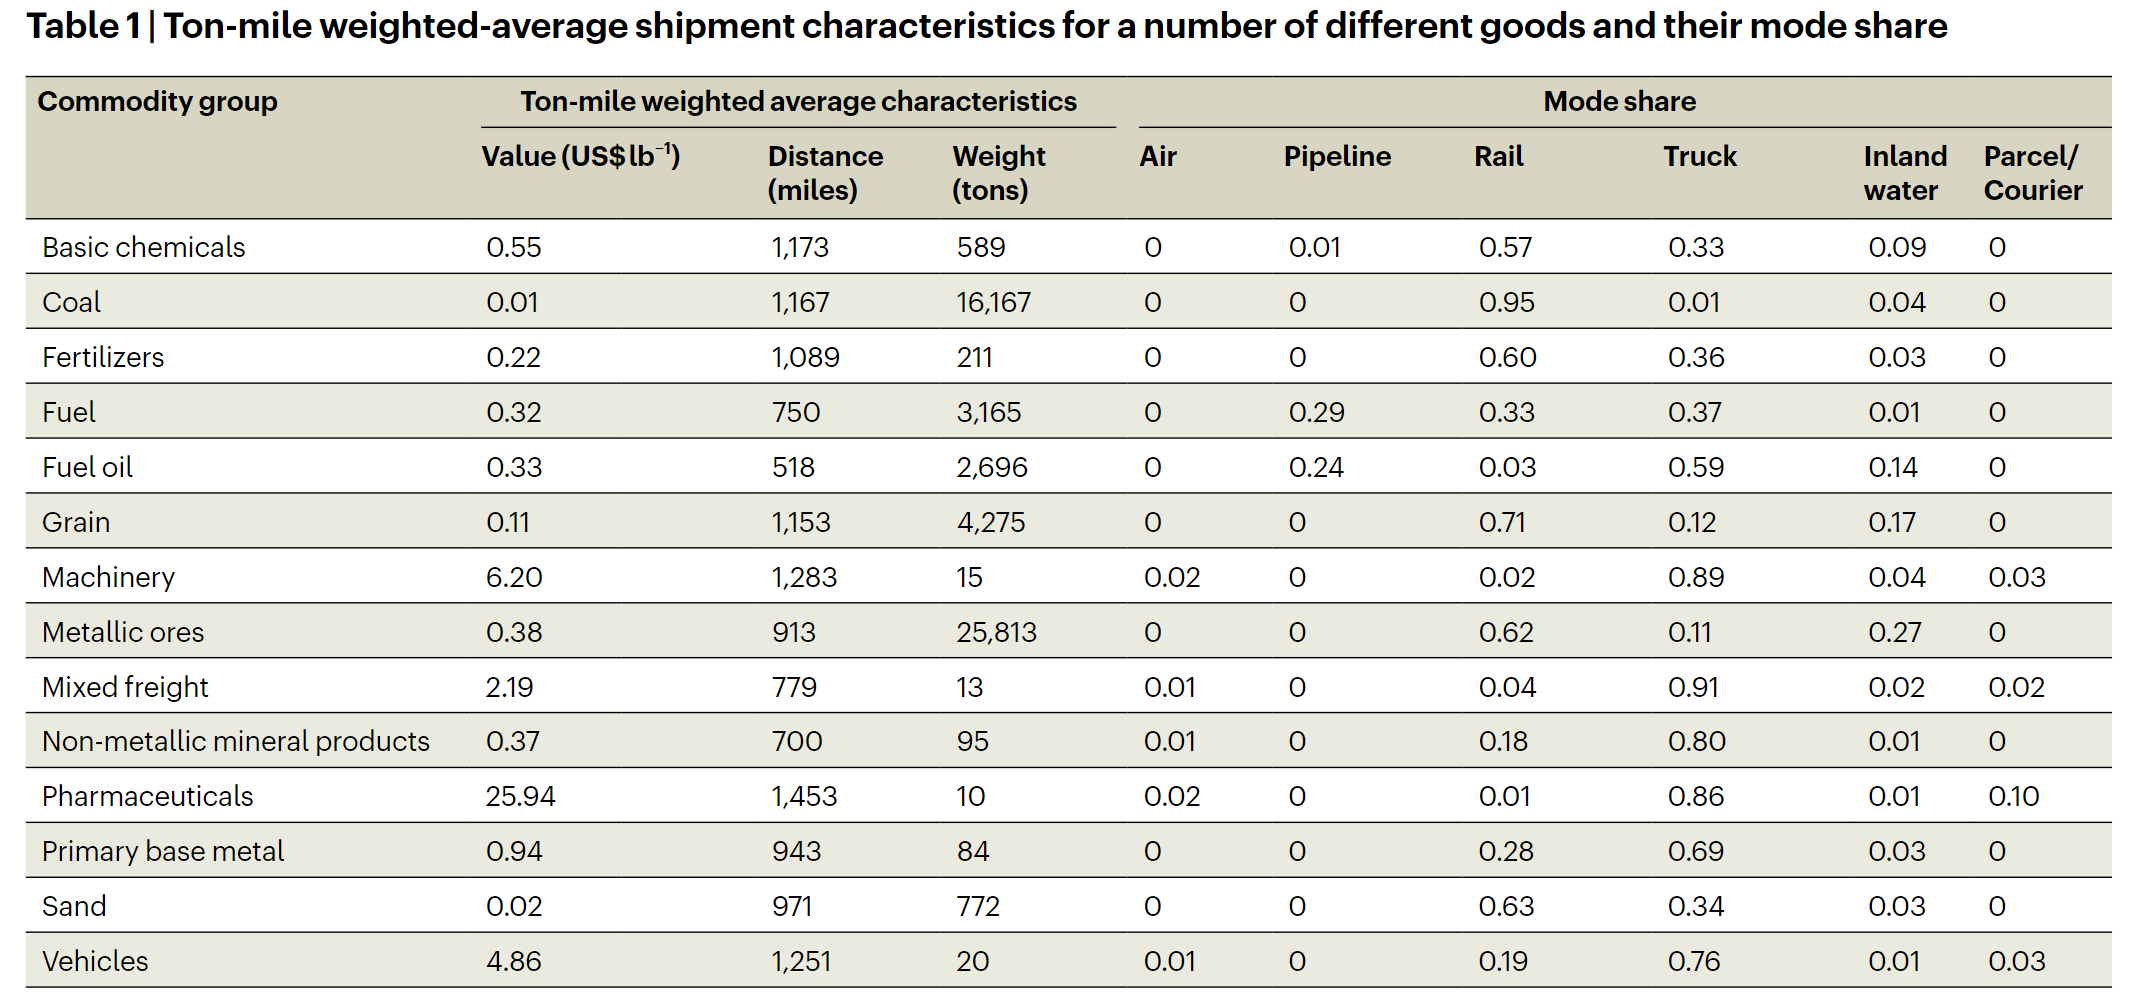
- Domestic freight and goods movement contributes to around 4% to US GDP; Trunk shipments represent around 47% of total ton-miles, with the total value of 74%
- Rail shipment is around 500 ton-miles per gallon of fuel compared with around 100 ton-miles per gallon for heavy-duty trunks and 0.1 ton-miles per gallon for air freight
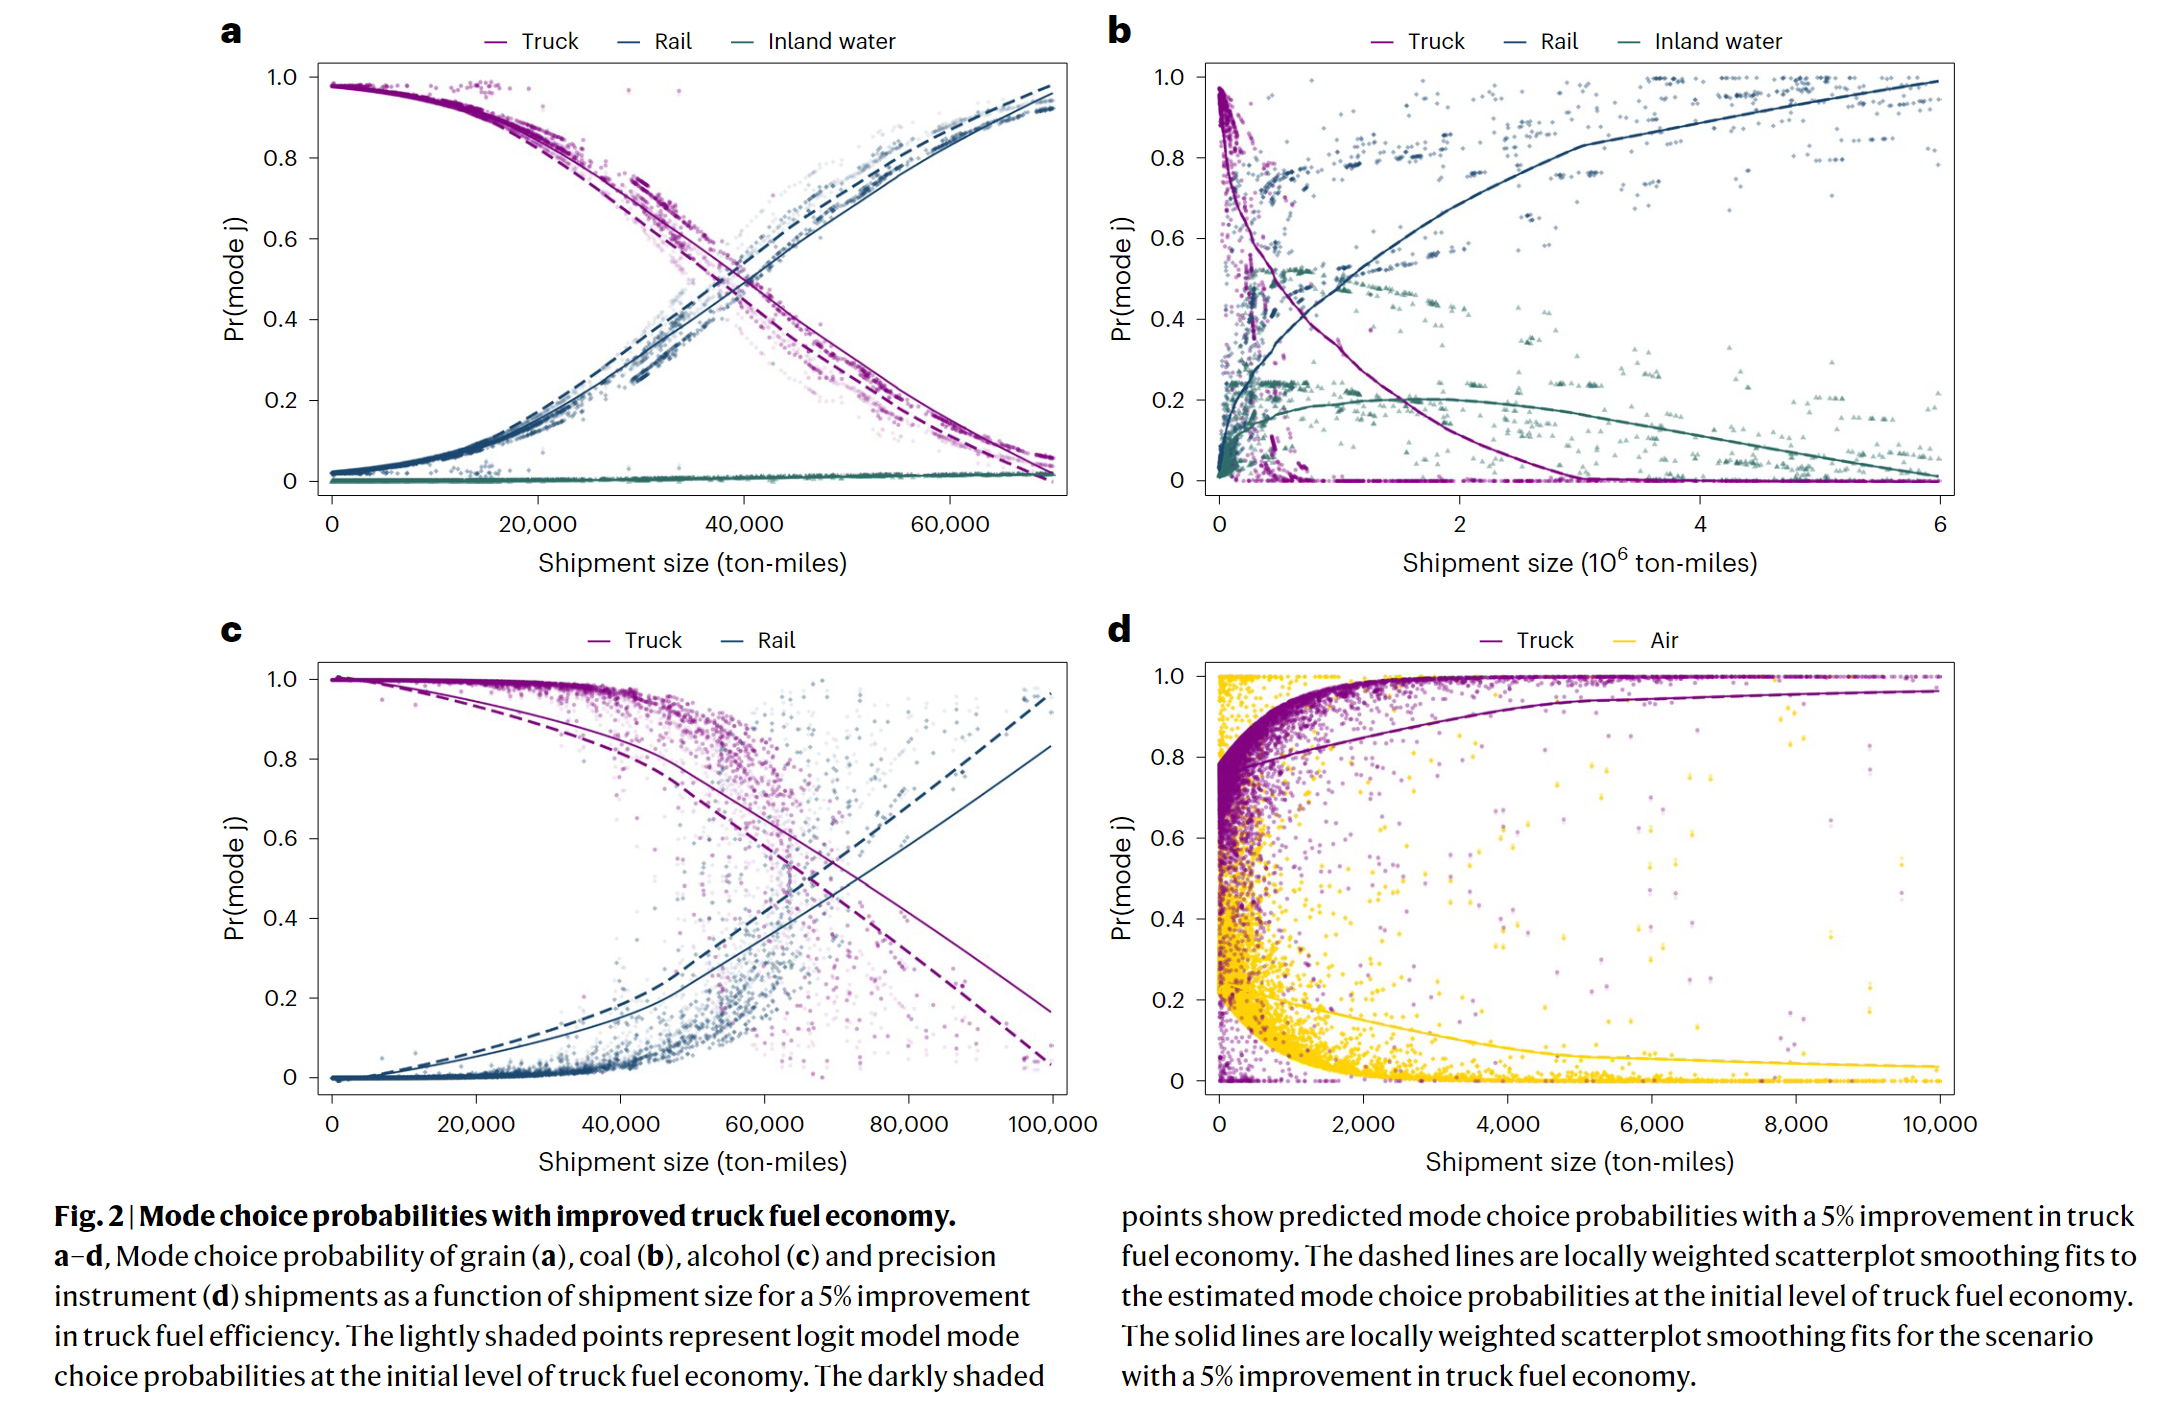
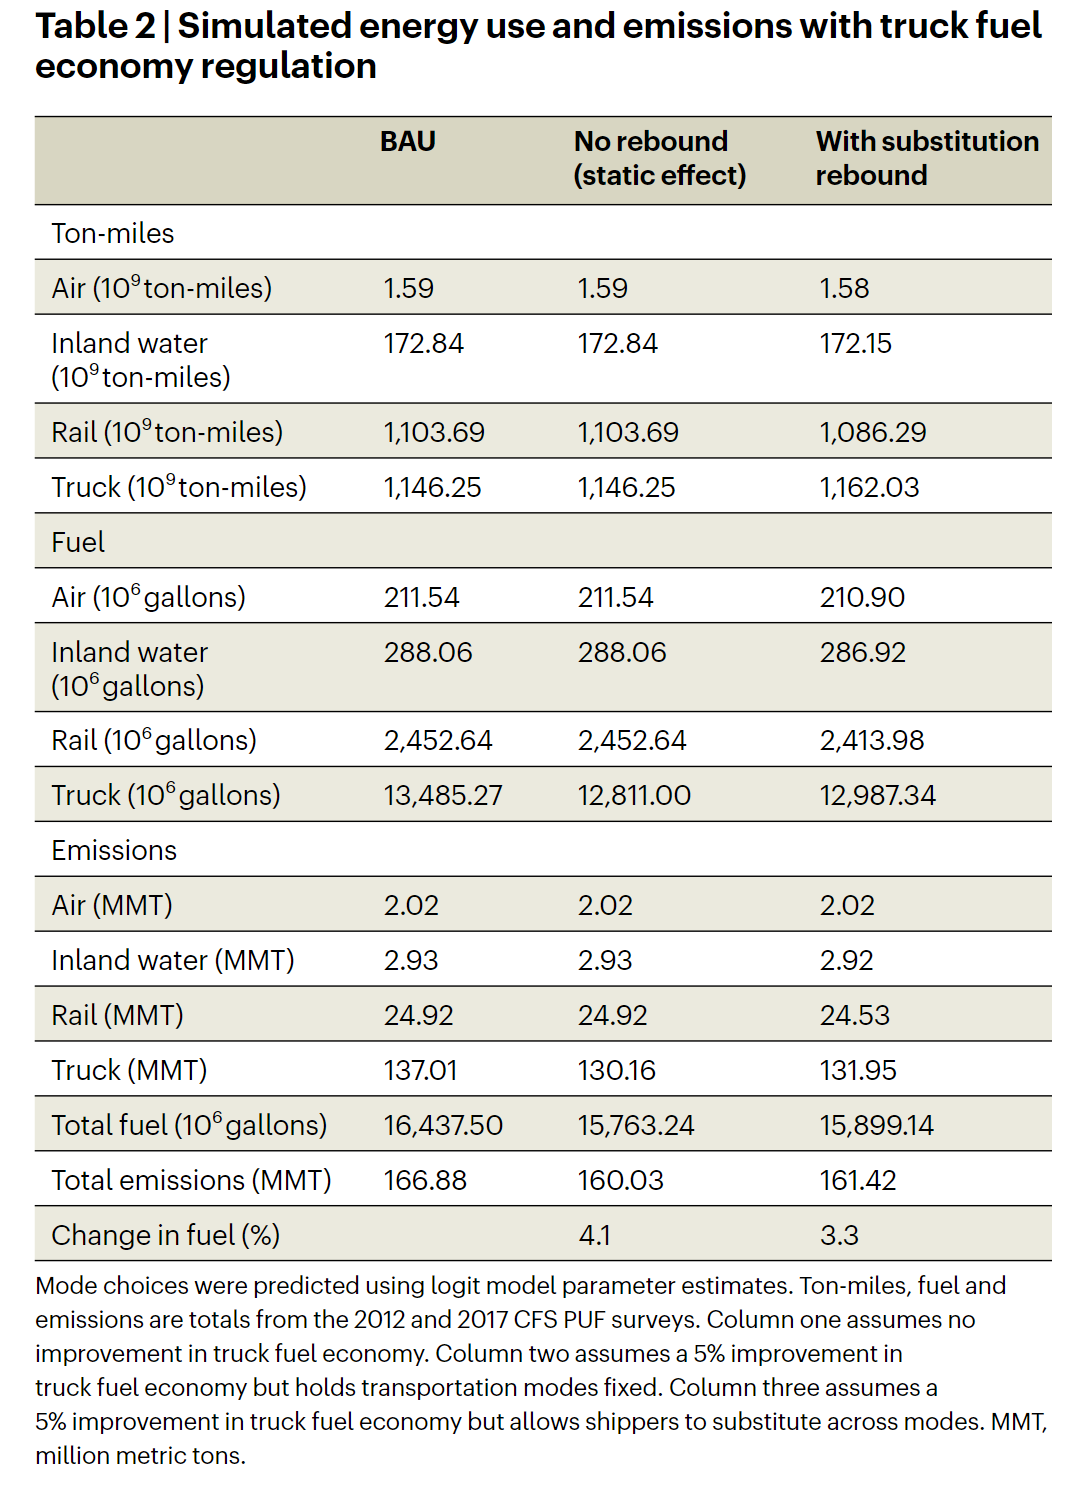
- Trunk fuel economy regulations shift freight shipments from rail to trunk, increasing trunk output by over 15 billion ton miles per year or around 1.4%
- This shift reduces fuel savings from more efficient trunks from 674 billion gallons per year to 497 million gallons per year, indicating a rebound effect of around 26%
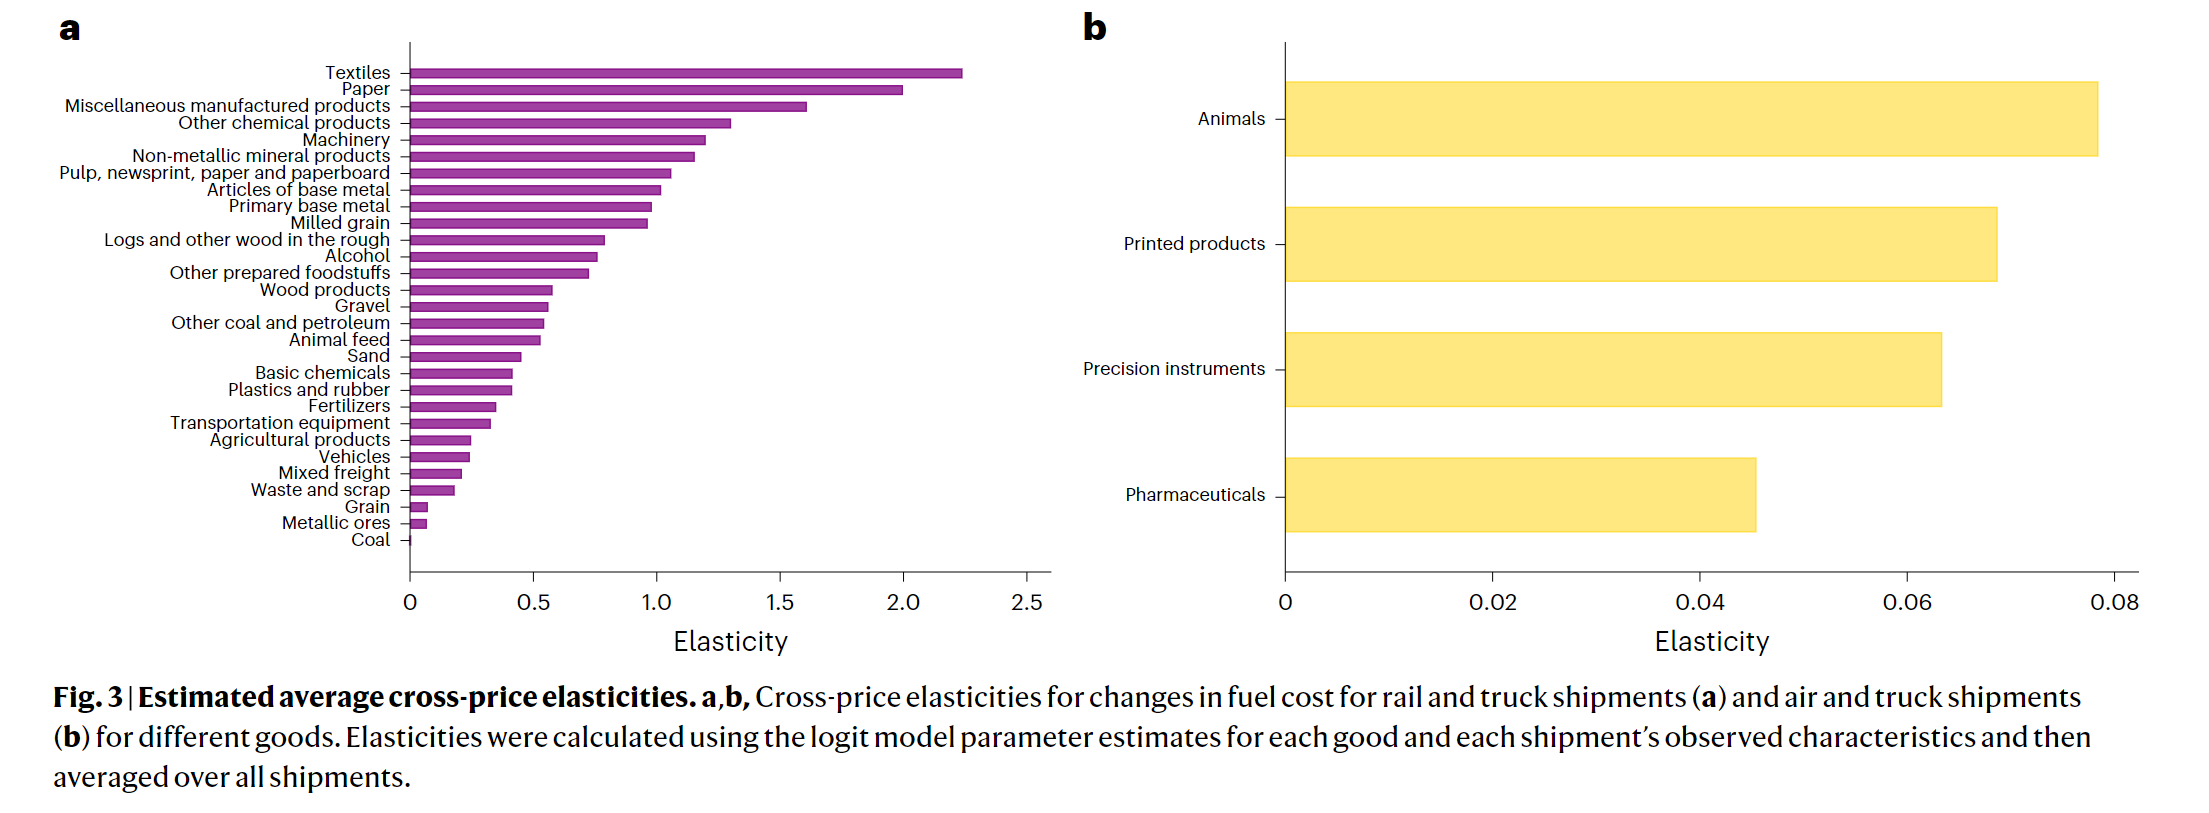
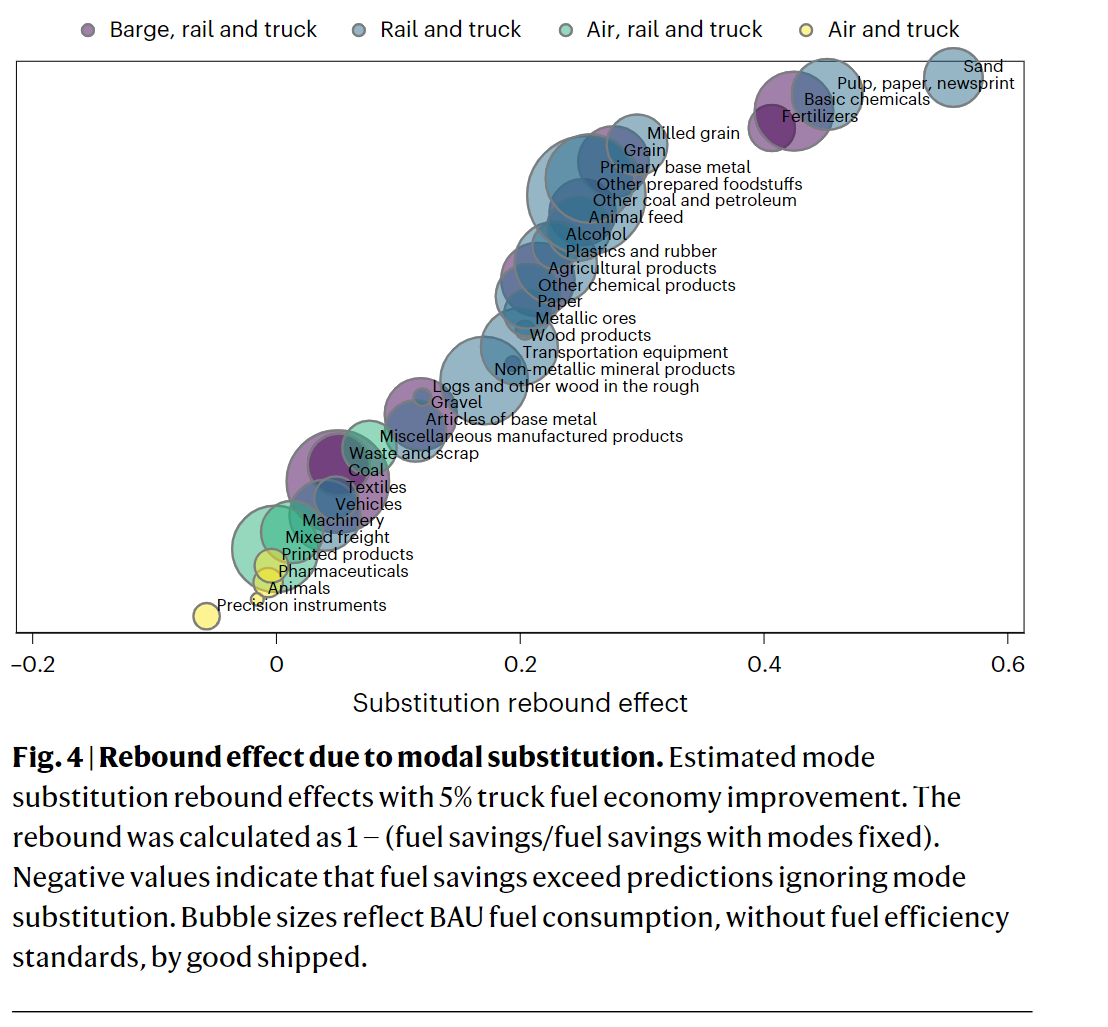
- This equates to an agggregate rebound effect from modal substitution across all freight shipments of around 20%; for some types of goods this effect is substantially large at 40-50%
Coding Reference:
