Objective:
- Explore how different factors affect SWB along the global sustainable development gradient
Case:
Methodology:
- SWB: World Happliness Reports
- SDG evenness: Mean SDG index score (MIS) gradient
- Radar chart method: $Even = S_i / (\pi (\frac{L_i}{2\pi}^2))*100$
- $S_i = \sum_j S_j = \sum_j \pi f_j r_j^2$
- $L_i = \sum_j L_j = 2 |r_{max}-r_{min} | + \sum_j 2\pi f_j r_j$
- Moving window method
- Linear, polynomial (quadratic and cubic) and logrithmic regression
Data Source: Open
- SDG index score: sustainable development report
- SWB: world happiness report
- GDP: IMF
Findings:
- SWB evenness is relatively laggard dimension in fulfilling the SDGs
- SDG evenness and per capita GDP are positively related with global SW
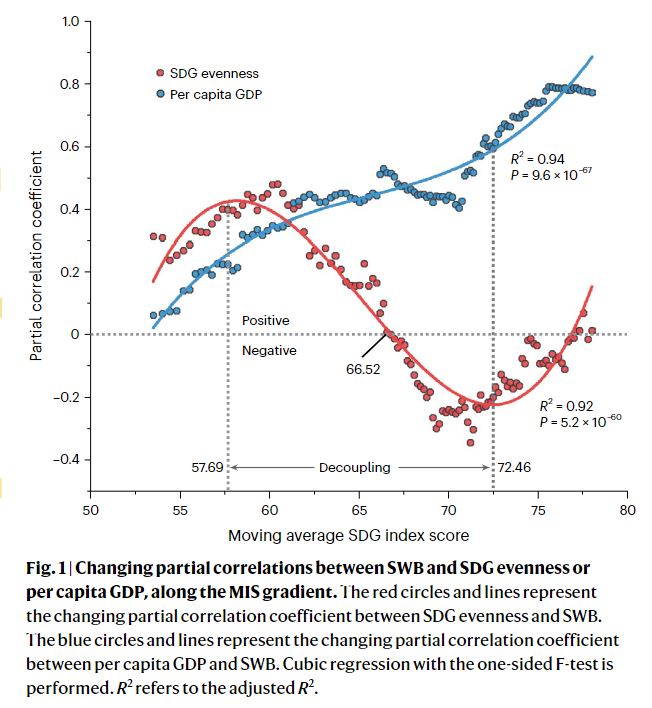
- SDG evenness showed positive relationship with SWB only in countries with low MIS
- Per capita GDP is higher in countries with high MIS
- Per capita GDP exhibited an increasing positive partial correlation with SWB, from weak to strong along with increasing MIS
Coding Reference:
