Objective:
- Globally comprehensive and comparable estimates of human movement are lacking
Case:
- 242 countries, 5 km * 5 km
Methodology:
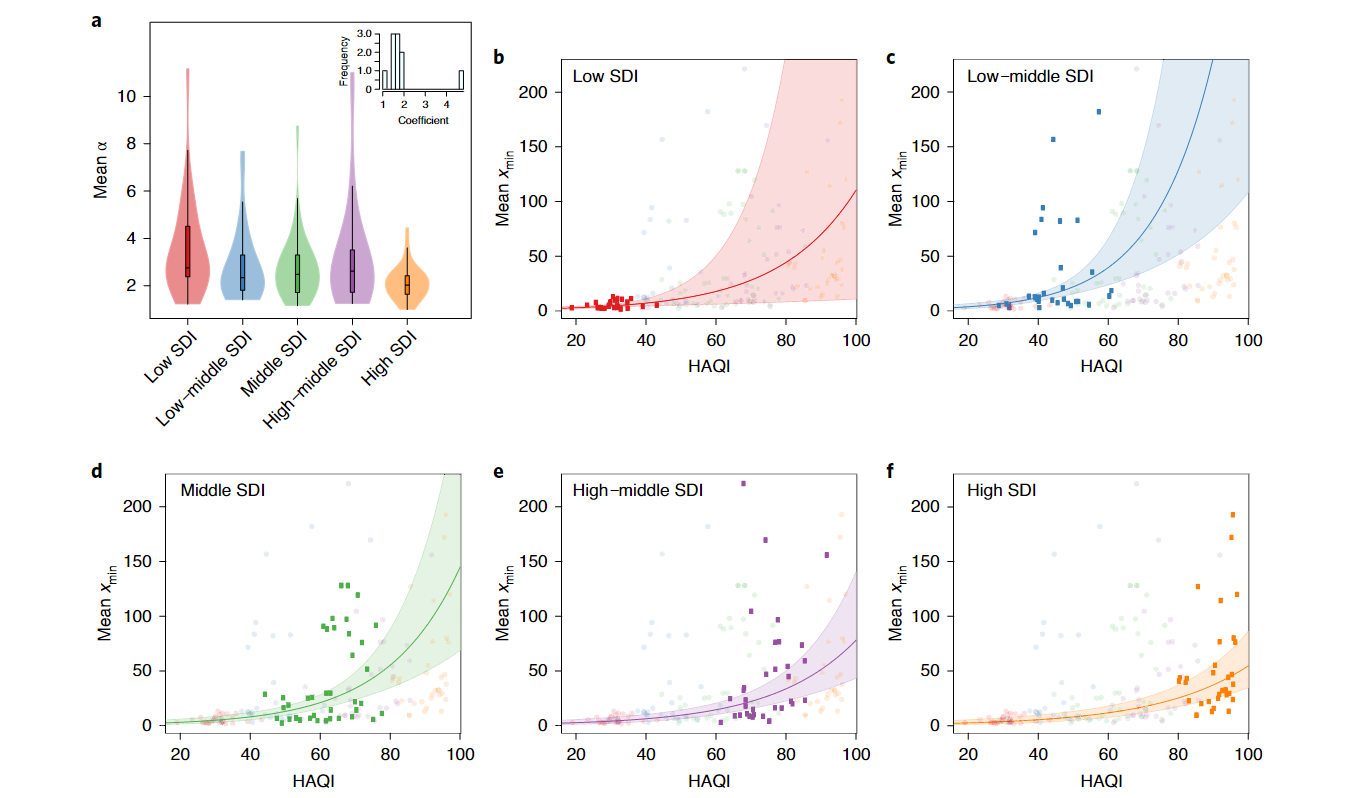
- Scaling component $\alpha$
- $p(x) = x^{-\alpha} e^{-\lambda x}$, where $x$ is time value
- $\widehat{\alpha} \approx 1+n[\sum_i^n log(\frac{x_i}{x_min})]^{-1}$
- Regression:
- $log x_i \approx HAQI * SDI_q + \epsilon$
- $KS - Distance \approx s(SDI) + s(Nobs) + s(Size) + \epsilon$
Data Source: Open
Findings:
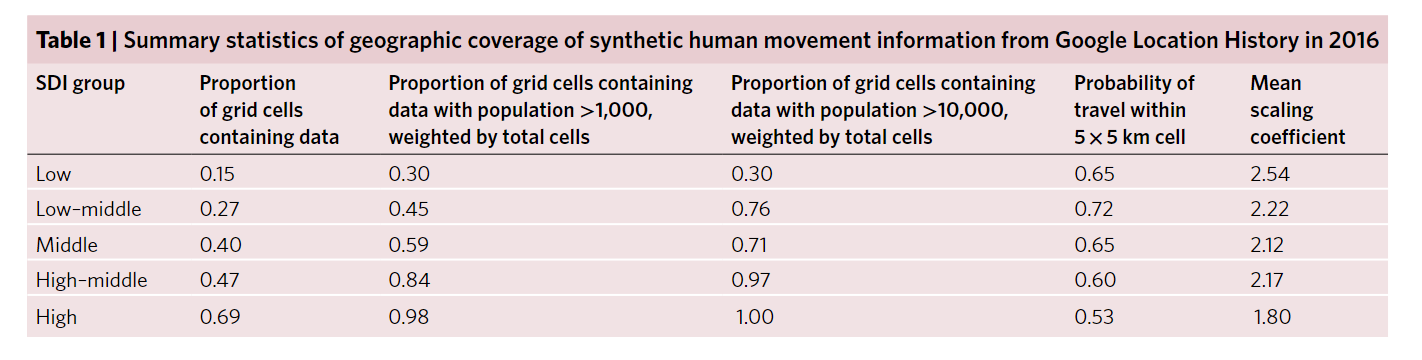
- Data from low-income regions are more concentrated in and around urban areas and along major road
- The lowest frequency of movement is observed in Jan
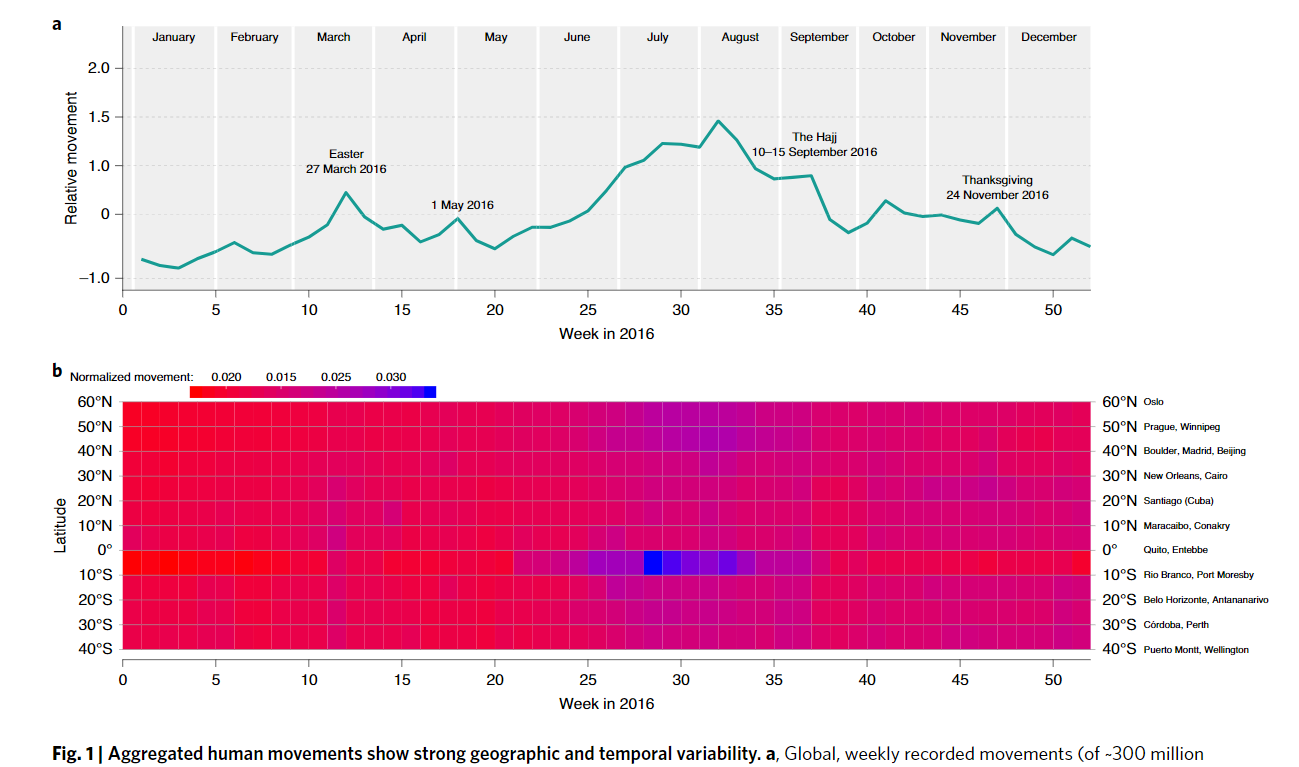
- Global mobility is concentrated primarily between northern latitude 30 and 50
- Weather patterns and length of daylight influence movements
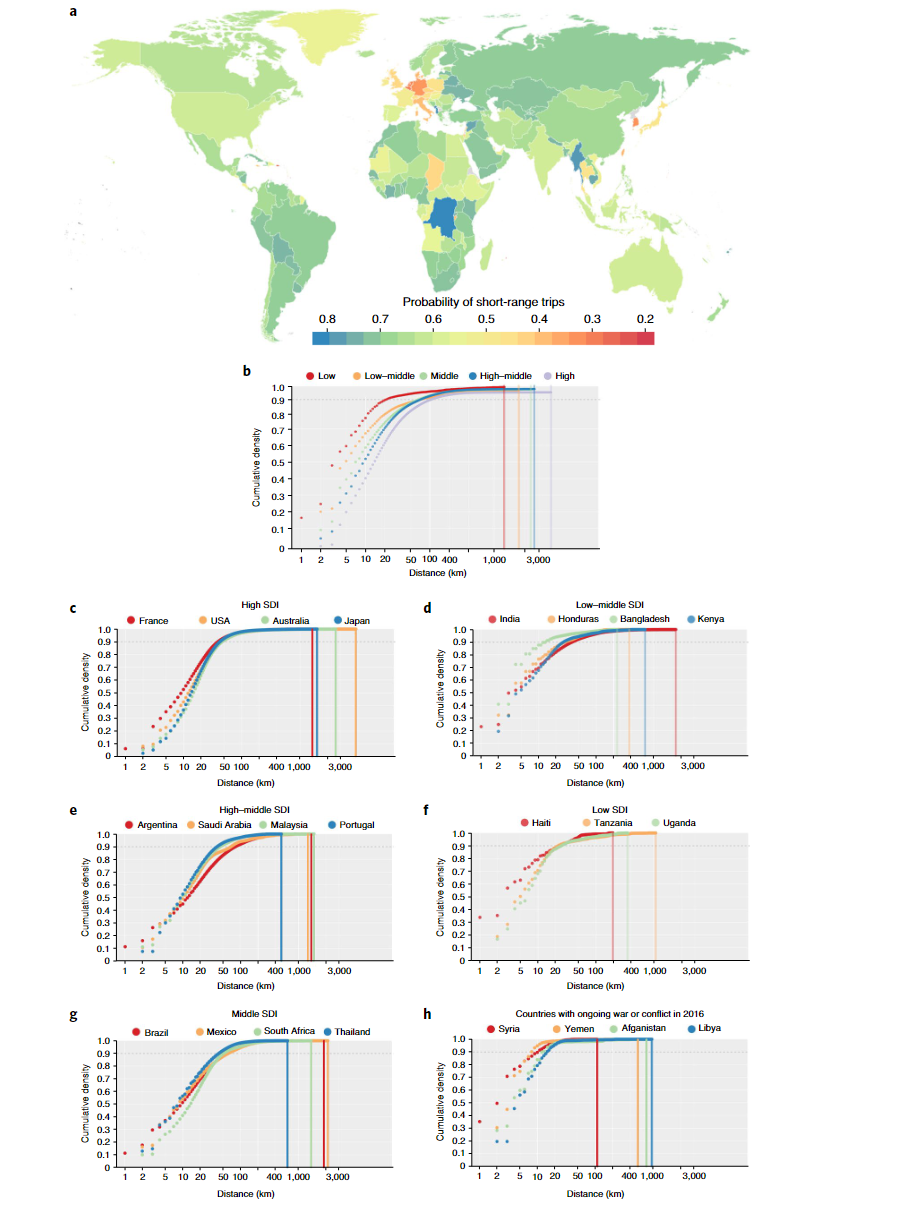
- Global mean trip distance is large at 170 km (meadian 11.97 km)
- Trips with length over 60 km make up only 10% of all recorded flows
- Trip is highly correlated with sociodemographic index
- When countries are grouped by SDI, the distribution of trip frequencies differ substantially between groups but show strong consistency with each group
- Human movements decline much faster as a function of distance in low-income settings than in high-income settings
- 55% of the countries follow the power law (lognormal distribution); Heterogeneity: income, urban and rural
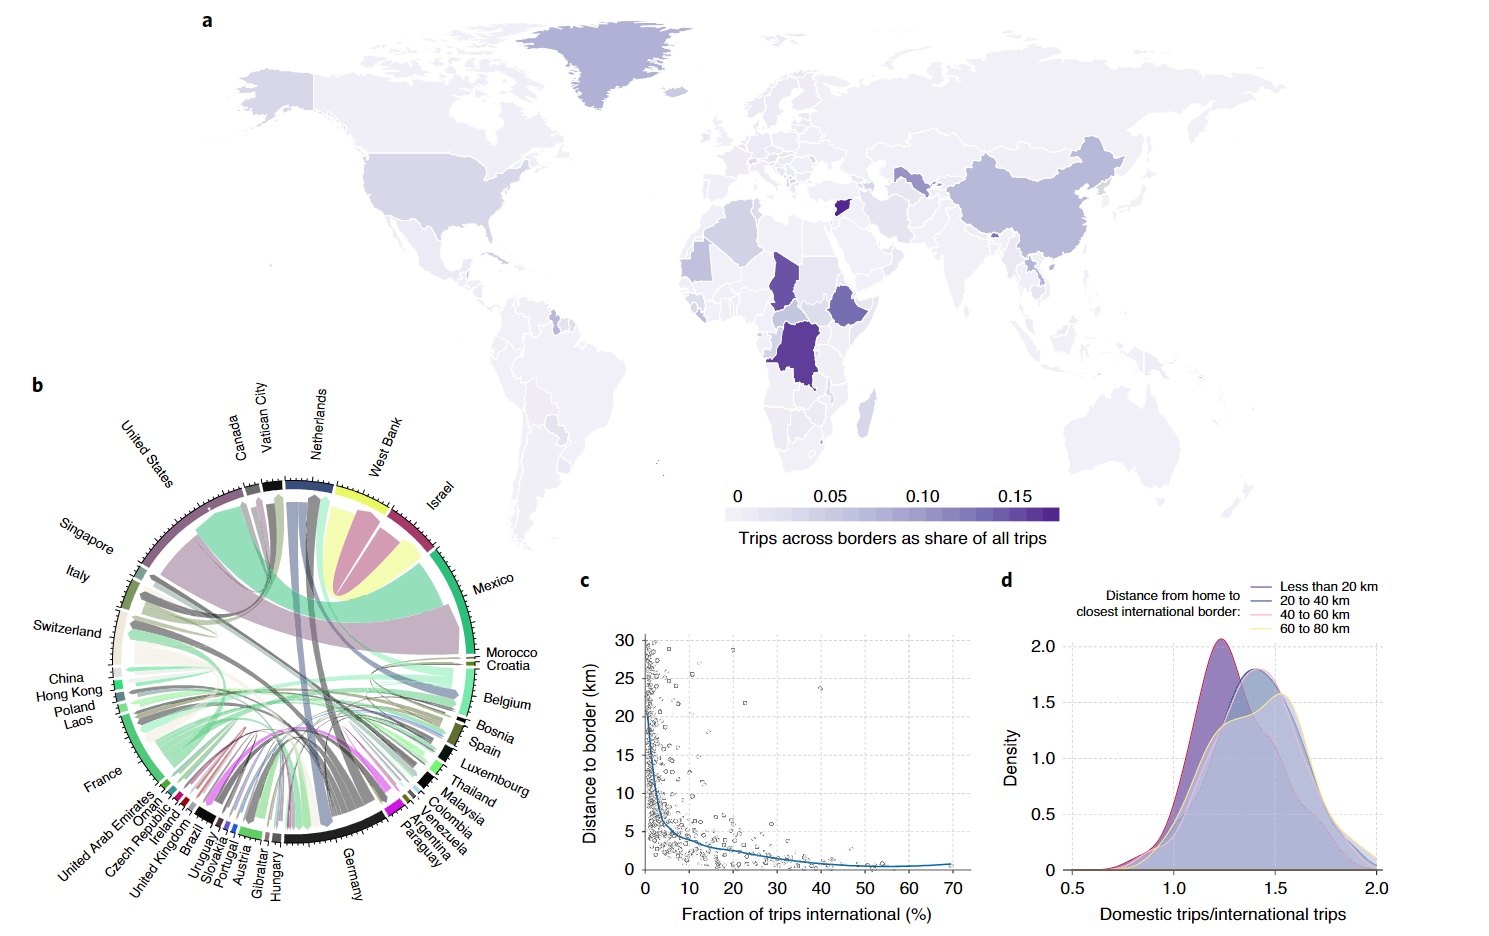
- For cross border movements, the people travel predominantely between countries that are in close proximity and have similar GDP
- The smaller the country, the higher likelihood of travelling internationally as sahre of all movements
- The frequency of international travel increases remarkedly with proximity to the border
Coding Reference:
