Objective:
- Estimate household carbon footprint for 12 income groups in China
Case:
Methodology:
- Environmentally extended input-output analysis:
- $X = (I-A)^{-1}F$
- $C = K(I-A)^{-1}F$
- $C_h = K(I-A)^{-1}H$
- $C = E V F O$
- $E$: total final consumption + input for thermal power + input for heating - used as chemical materials - loss
Data Source: Open
- Multiregional input output table
- Carbon emission: GTAP
- Price: yearbook
- Import price: National accounts main aggregate database
- Energy: China energy statistical yearbooks
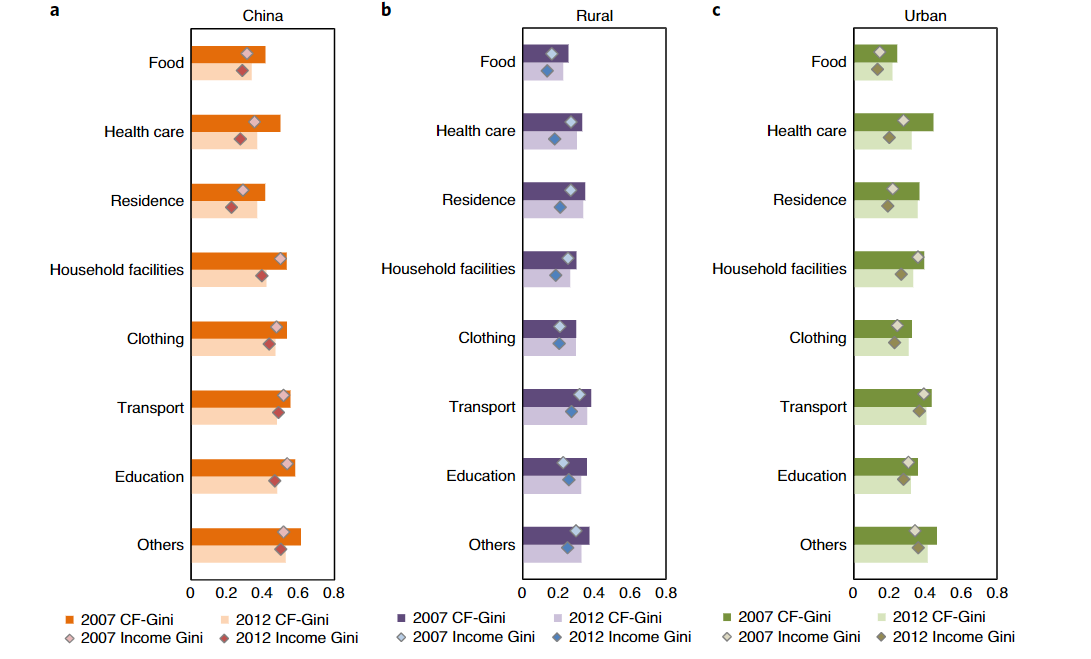
- Income group, eight group of expenditures: provincial yearbook
Findings:
- The proportion of carbon footprint attributed to households is relatively lower in China than in developed countries
- China’s household carbon footprint increased by 27% between 2007 and 2012; the household footprint increased much faster in poorer western regions than in wealthier eastern regions
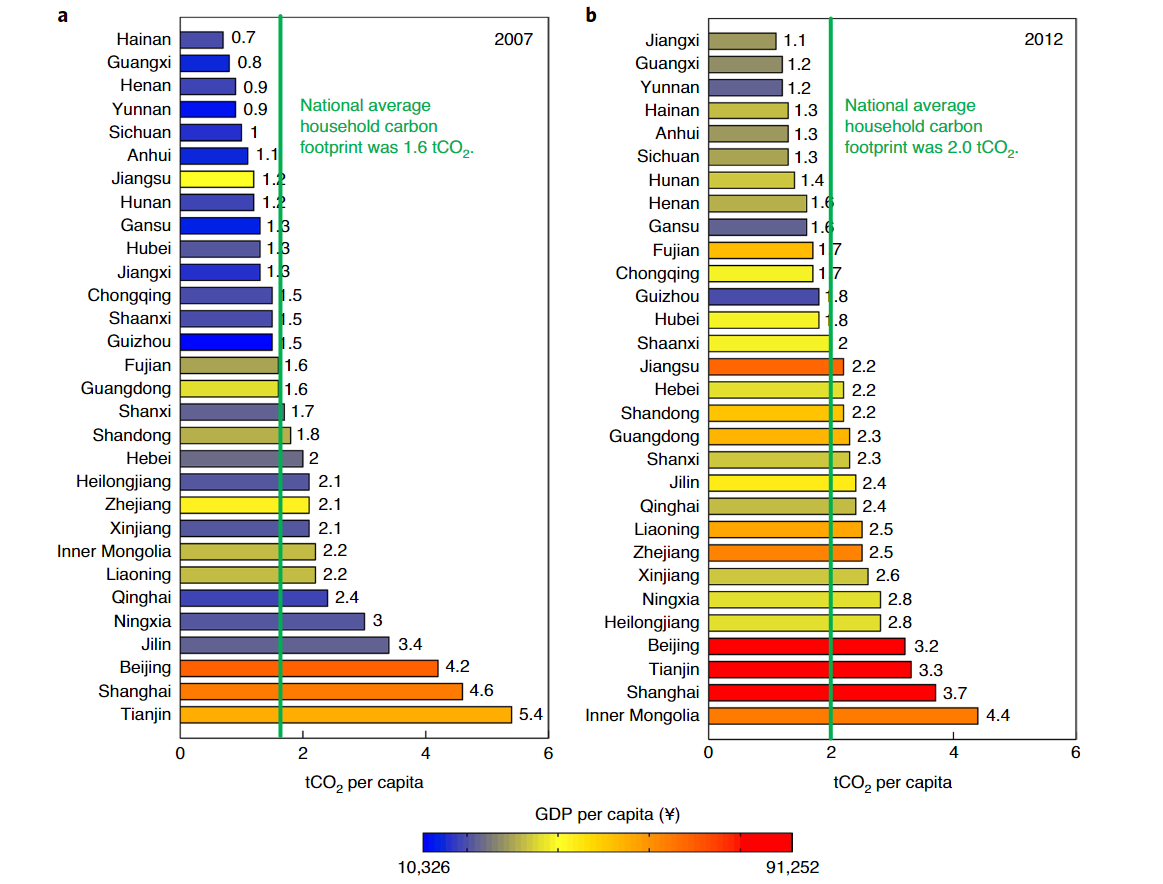
- Wealthy regions usually have a higher per capita carbon footprint than poor regions
- Urban residents induced 74% of the national household carbon footprint (2.5 times that of rural residents)
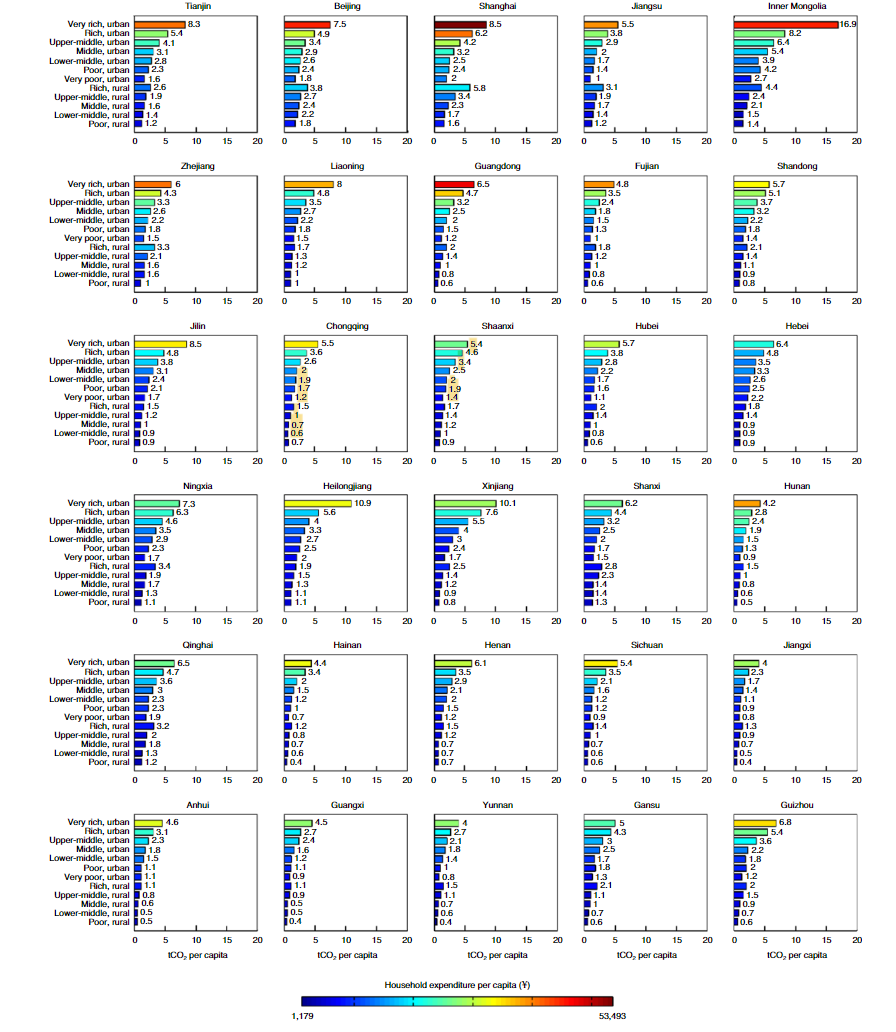
- The highest per capita houshold carbon footprint and lowest values are mostly located in relatively poor provinces
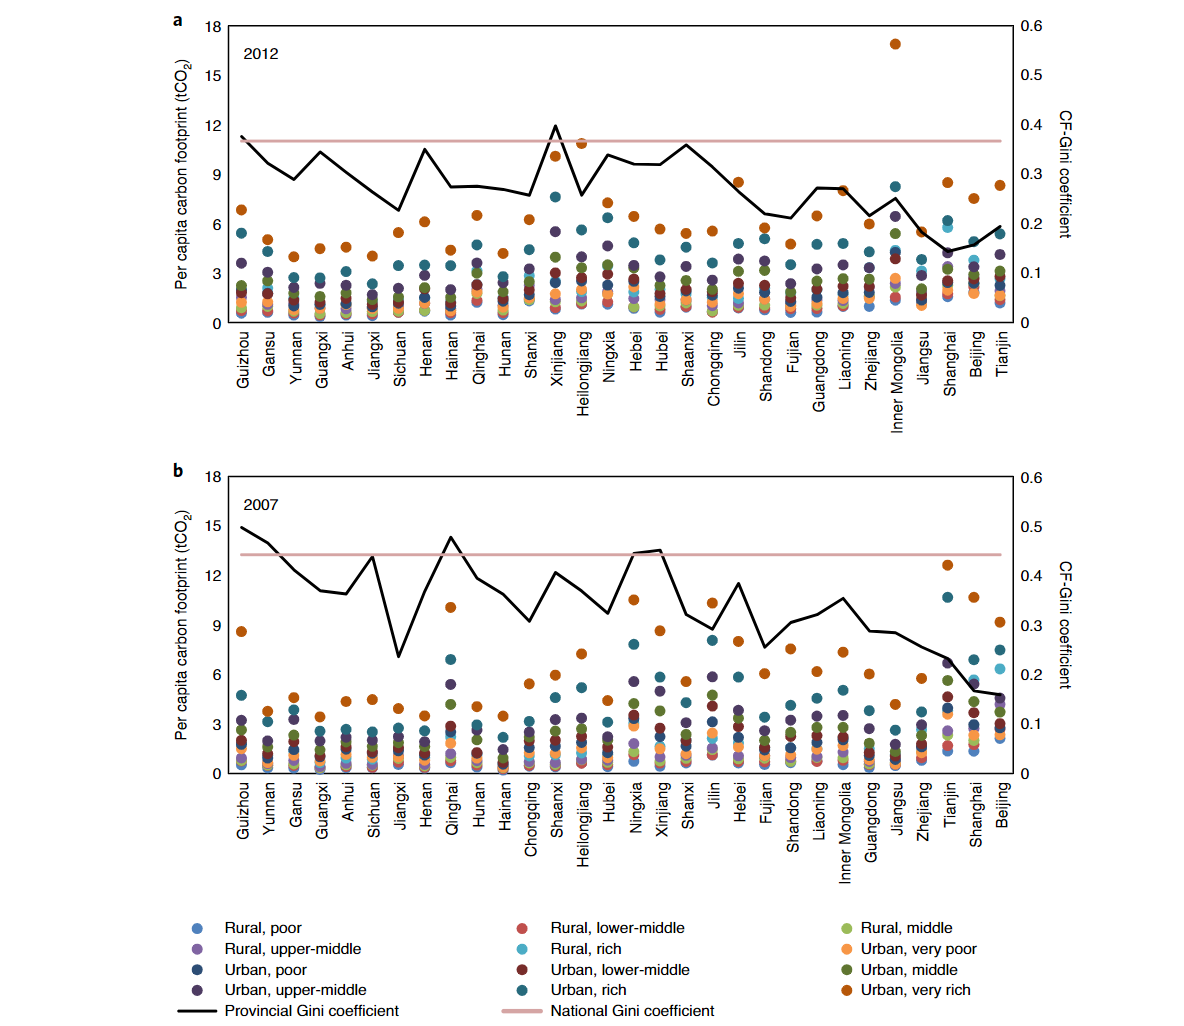
- At the national level, carbon emission inequality declined
Coding Reference:
