Objective:
- Build an energy and expenditure extended input-output model that distinguishes between income groups of households
Case:
Methodology:
- Power law
- Leontief matrix and energy consumption for households
- Inequality: Lorenz and Gini
Data Source
- GTAP 9
- Global consumption data: World Bank (BRICS states), Eurostat household budget surveys
- Final energy consumption: IEA
- International standard Industrial classification of economic activities revision
- Income per capita growth: OECD (Future)
Findings:
- Energy footprint scale sublinearly with expenditure
- Expenditure at higher levels becomes slightly less energy intense
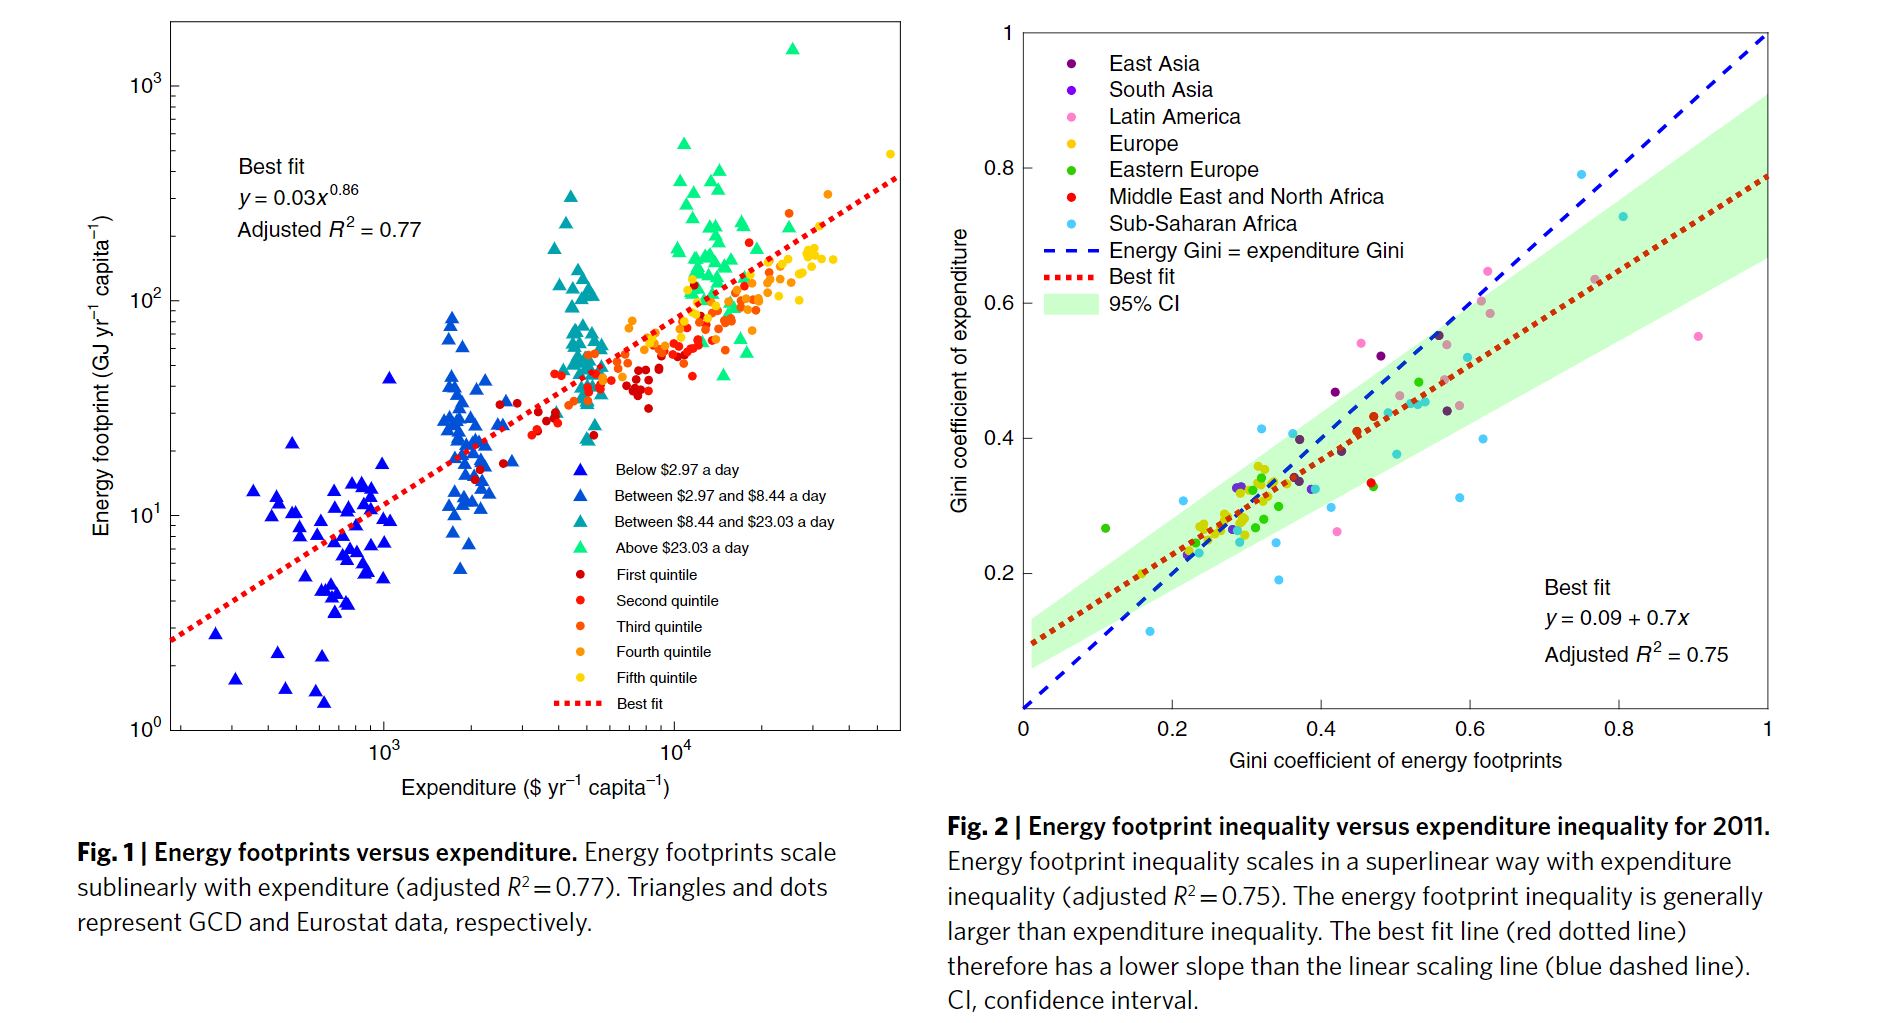
- Energy footprints vary more widely in their inequality than expenditure does
- The pattern is even more pronounced when comparing income inequality and energy inequality
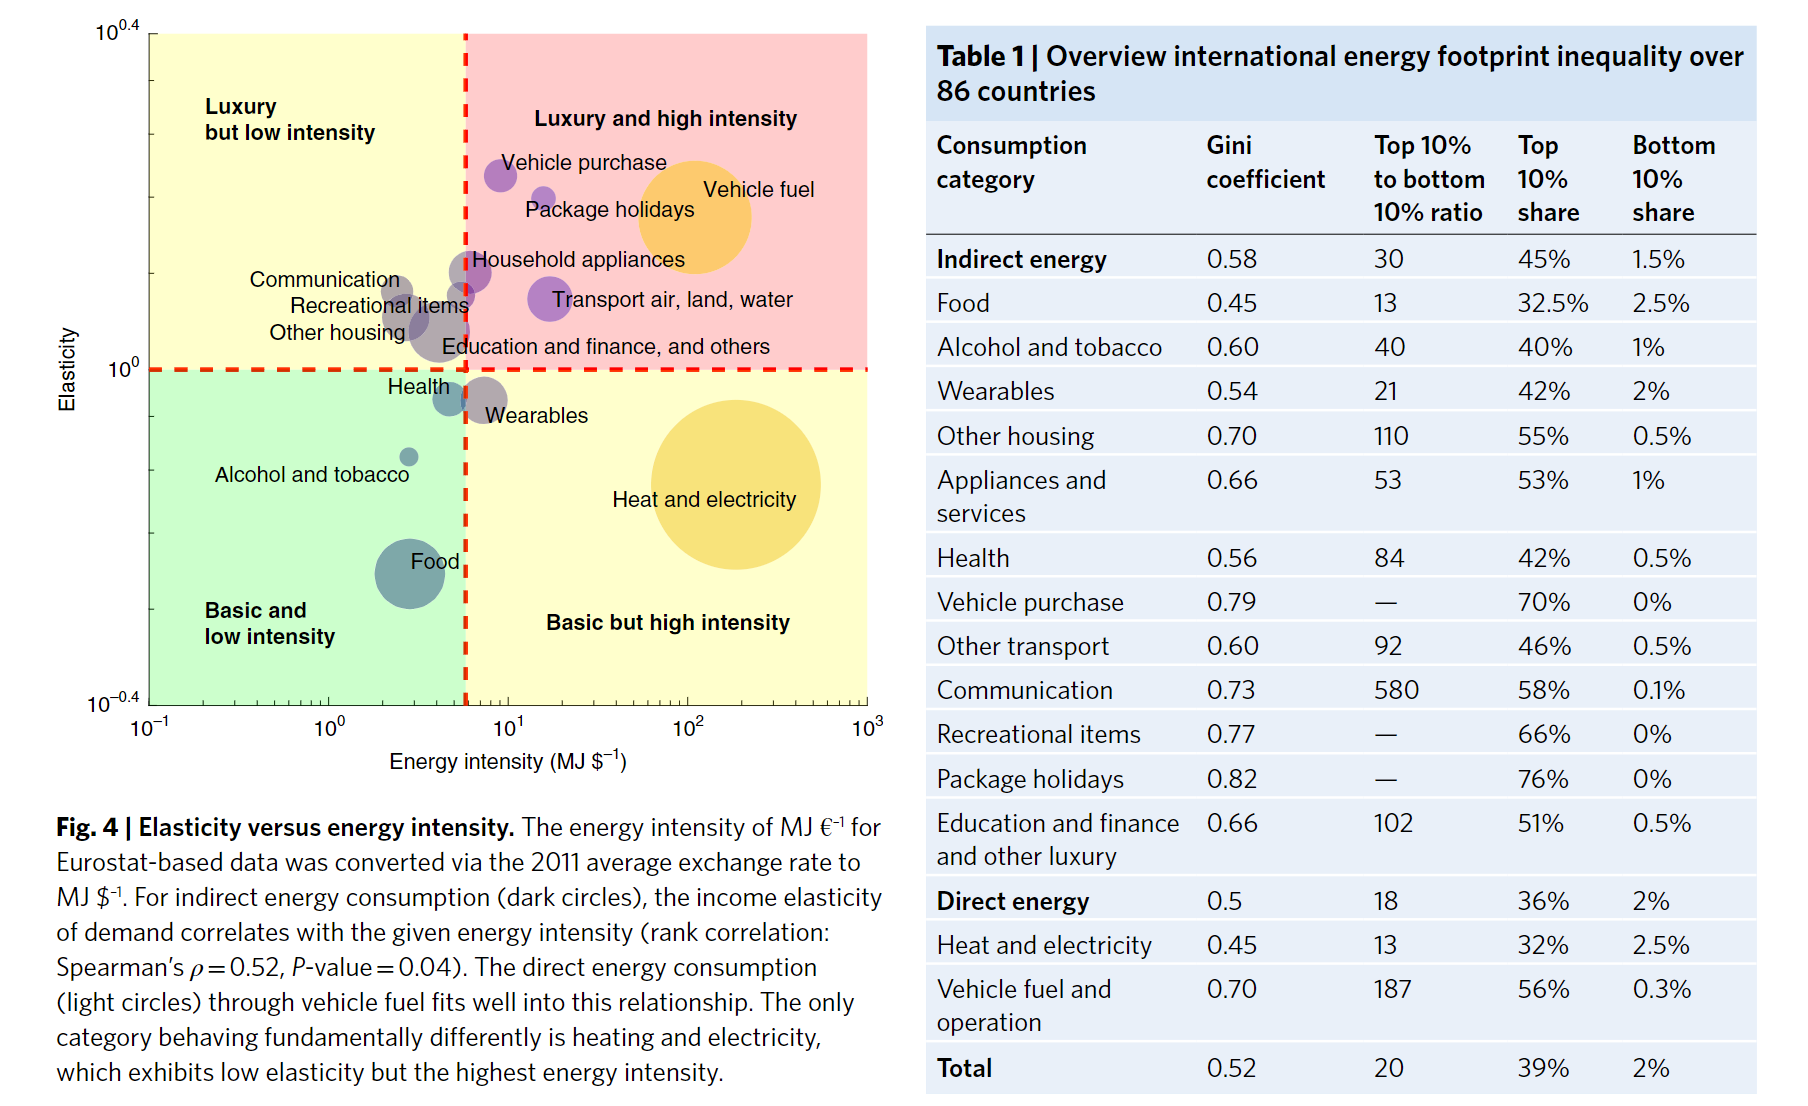
- Top 10% consume ~39% of total final energy
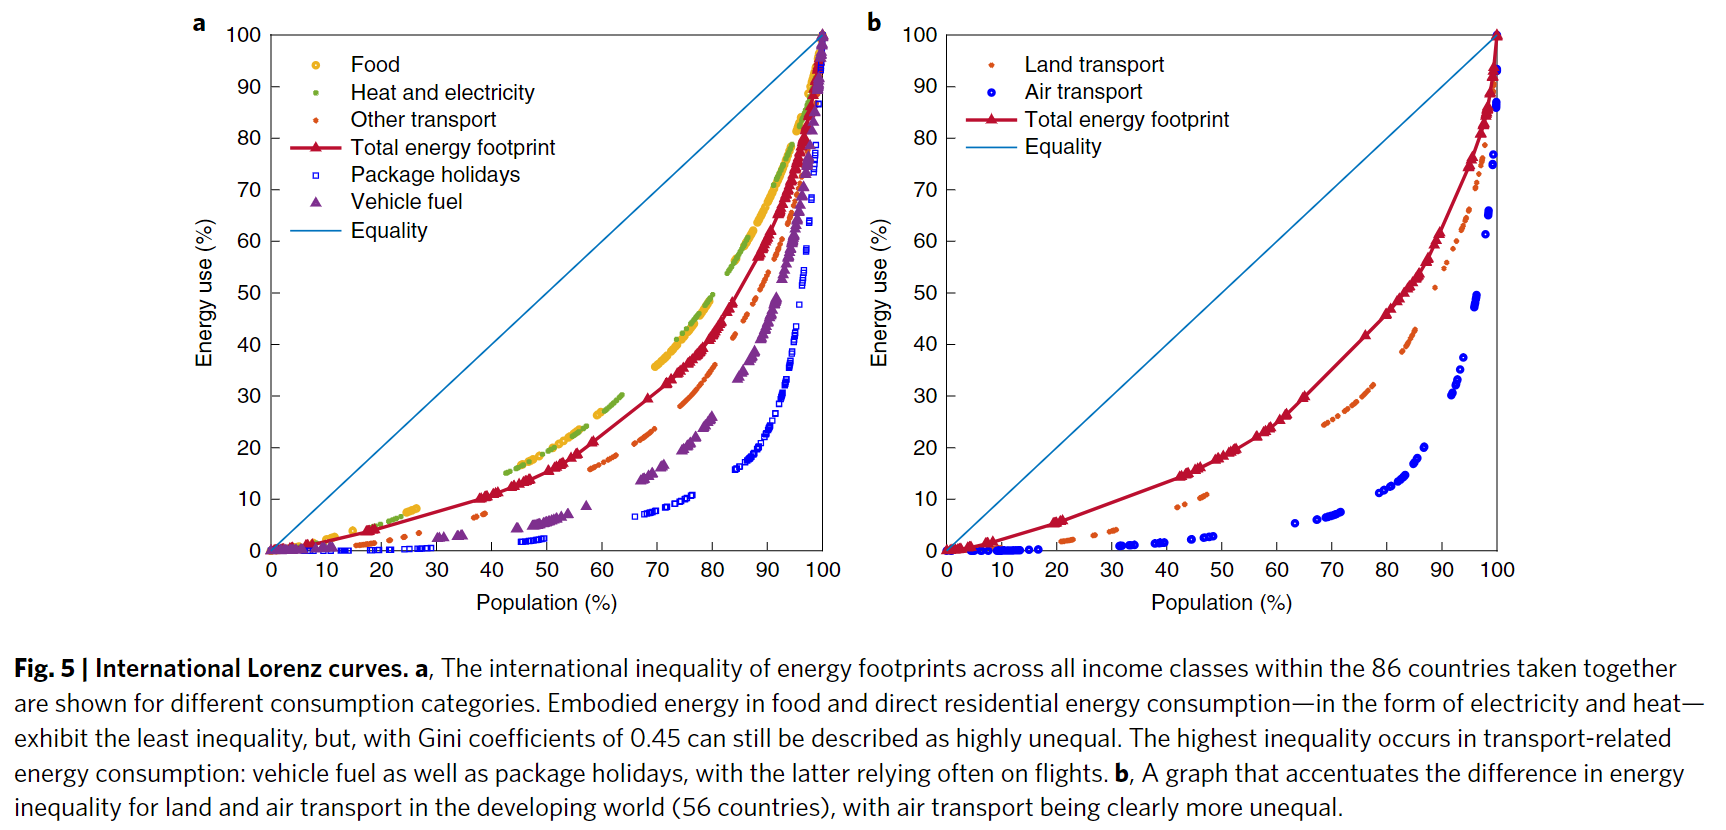
- In land transport, the bottom 50% receive a bit more than 10% of the energy used and in air transport they make use of less than 5%
- The top 10% use ~45% of the energy for land transport and around 75% for air transport
Coding Reference:
