Objective:
- How the environmental footprints of consumption and responsibilities for planetary boundaries transgression are distributed across different expenditure (income) groups globally
Case:
Methodology:
- EE-MRIO
- Downscale
- Gini index
Data Source
- MRIO: GTAP11
- Household expenditure:
- World bank global consumption database
- Eurostat household budget survey
- Japanese family income and expenditure survey
- Canada survey of household spending
- Austrailia household expenditure survey
Findings:
- The world’s wealthiest 10% of consumers was responsible for 43% of carbon emissions, 23% of HANPP, 26.1% of nitrogen fixation, 24.7% of phosphorus fertilizer, 18.5% of blue-water and 37.2% MSA loss
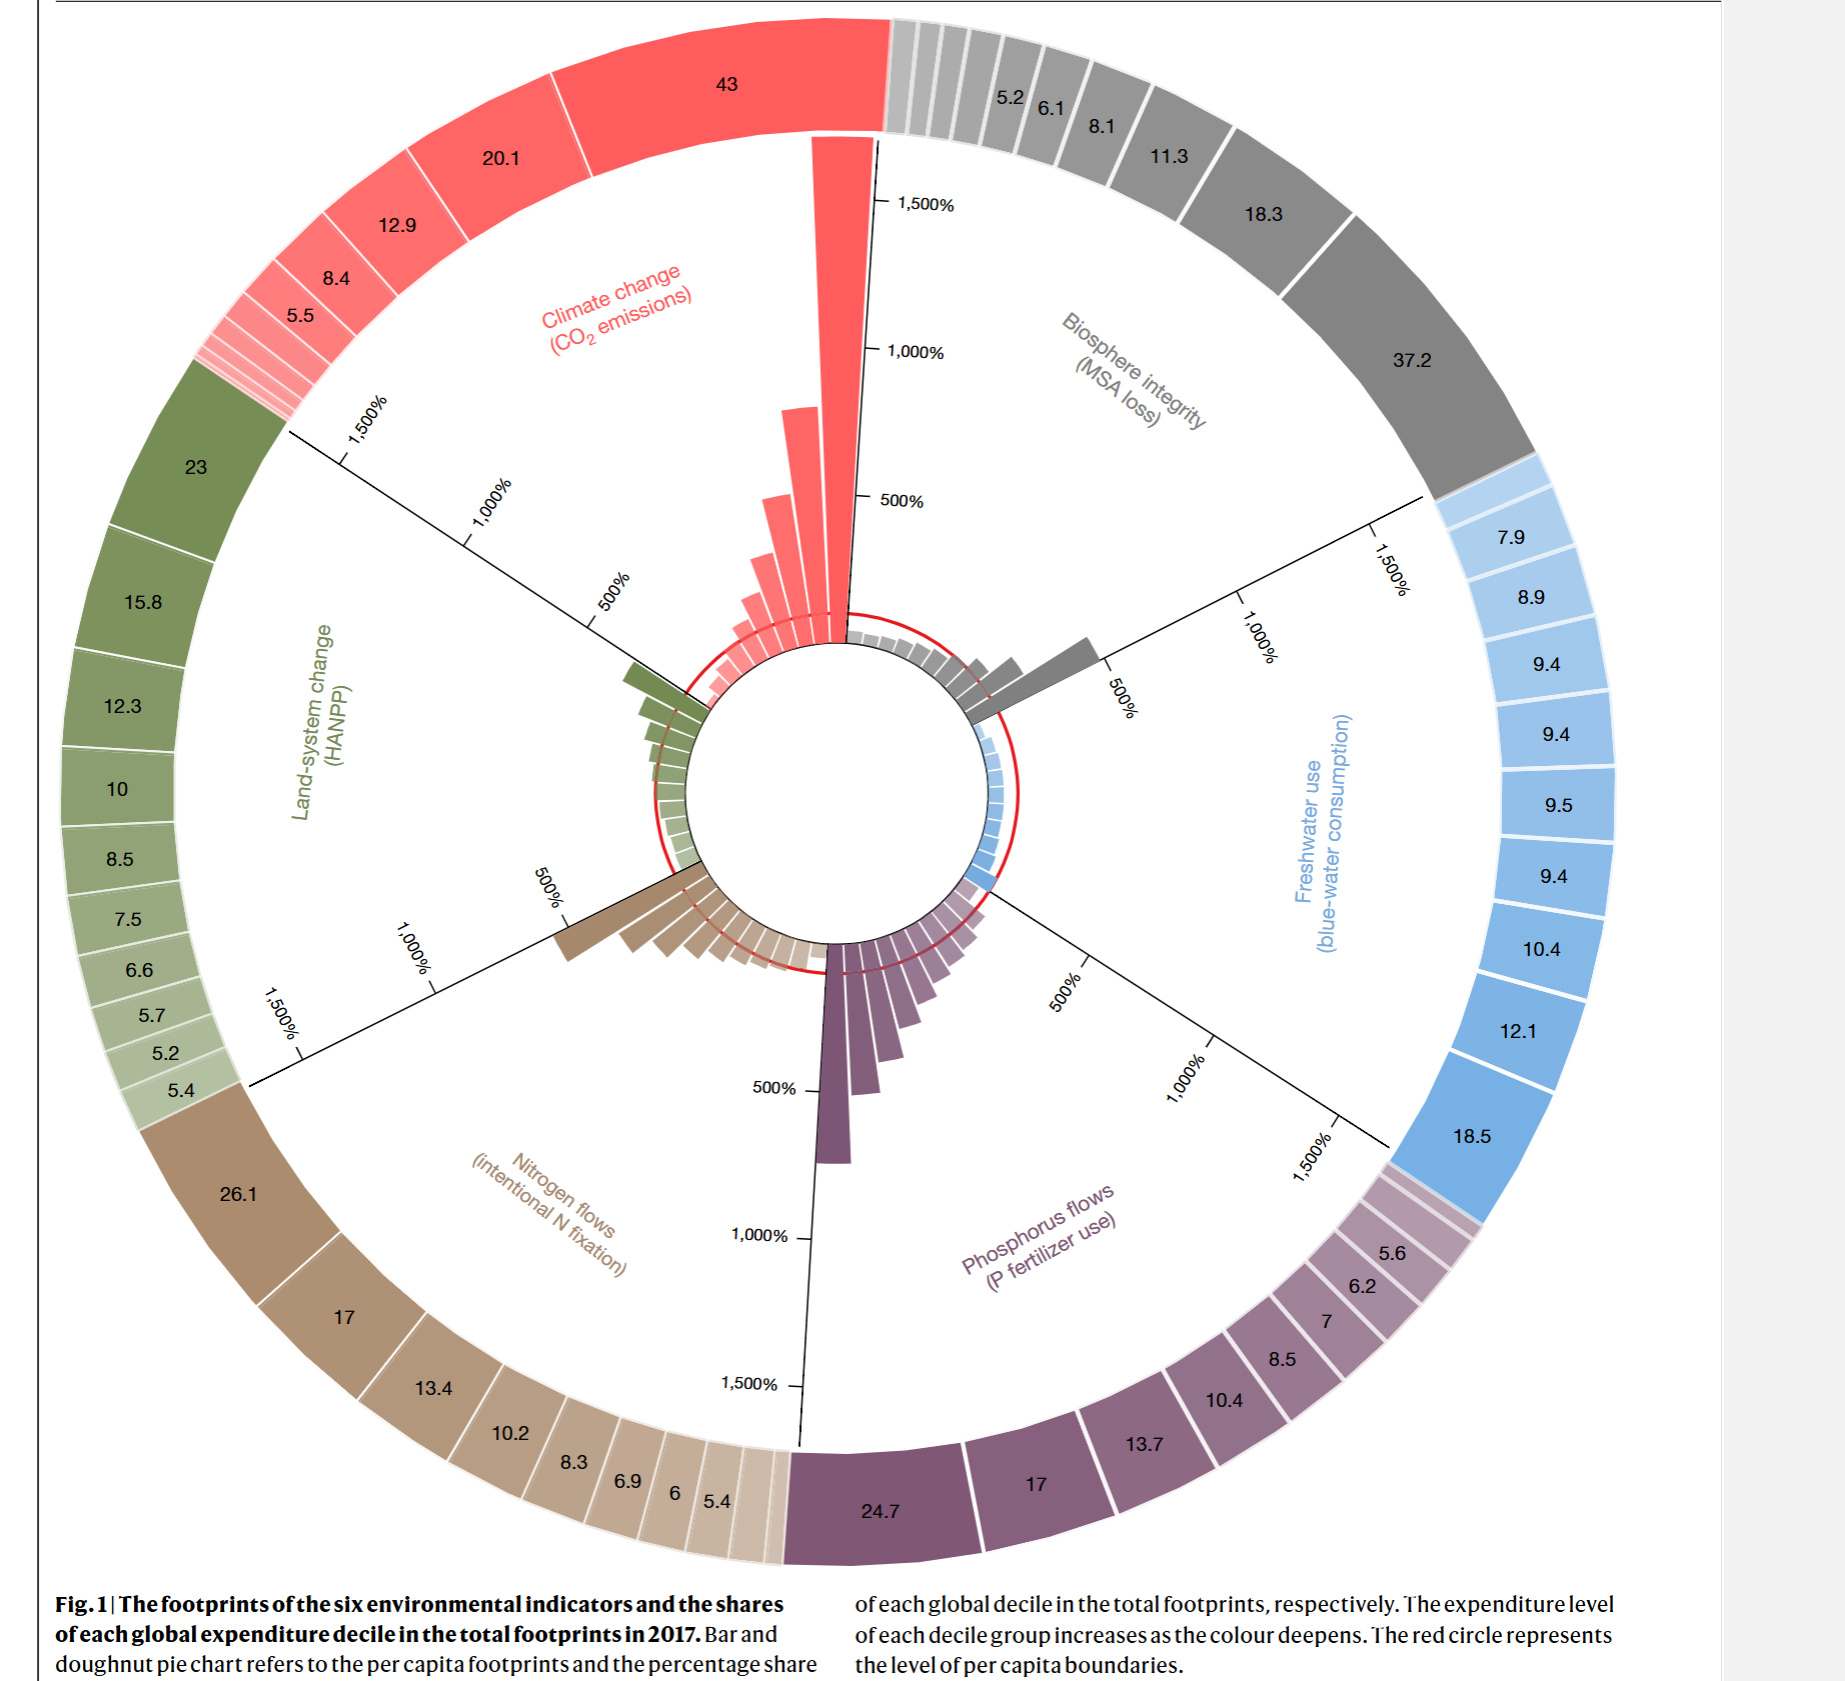
- The poorest 10% contributed marginally 5.4% to HANPP, 4.4% blue-water consumption and less than 3% to the other footprints
- On a per capita basis, the environmental impacts of the top 10% were 4.2 to 77 times that of the bottom 10%
- The consumption of the top 1% contributed 14% carbon emissions
Coding Reference:
