Objective:
- Provide an a fine-grained quantification of accessibility worldwide
- Narrow gaps in oppotunity by improving accessibility for remote populations and/or reducing disparities between populations with differing degrees of connectivity to cities
Case:
- 13,840 global cities
- 1 km * 1 km
Methodology:
- travel time to the nearest city: least-cost-path
- Road and railroad speed: OSM
- River: CIA world data bank 2 vector rivers dataset
- Automotic identification system and the Voluntary Observing Ship
- Walking: survey
- Speed is adjusted with slope
- Google Earth Engine
- Validation:
- R2: 0.66
- Mean absolute error: 20.7 min
Data Source: Open
- Open Street Map: (Roads, railroads, rivers, bodies of water, topographical conditions, land cover, national borders (GAUL))
- Google roads database
- Global Human Settlement Grid of high-density land cover (represent cities)
- Demographi and Health Survey: 52 countries
- Inland water bodies: global surface-water occurrence dataset
- Centres: contiguous cells with a density of at least 1,500 inhavitants, or a density of built-up greater than 50% and a minimum of 50,000 inhabitants
Findings:
- Highly accessible areas include those with abundant transport infrastructure and/or many spatially disaggregated cities
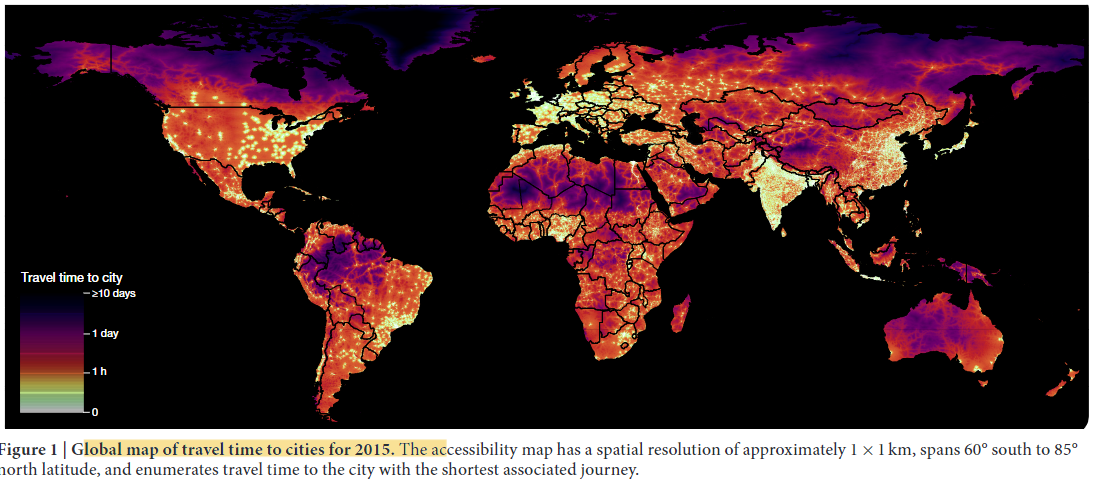
- 80.7% of people reside within one hour of cities, but accessibility is not qually distributed across the development spectrum. The disparity is evident when comparing accessibility for income groups (World Bank)
.png)
- Association with education and treatment fever among children under five
Coding Reference:
