Objective:
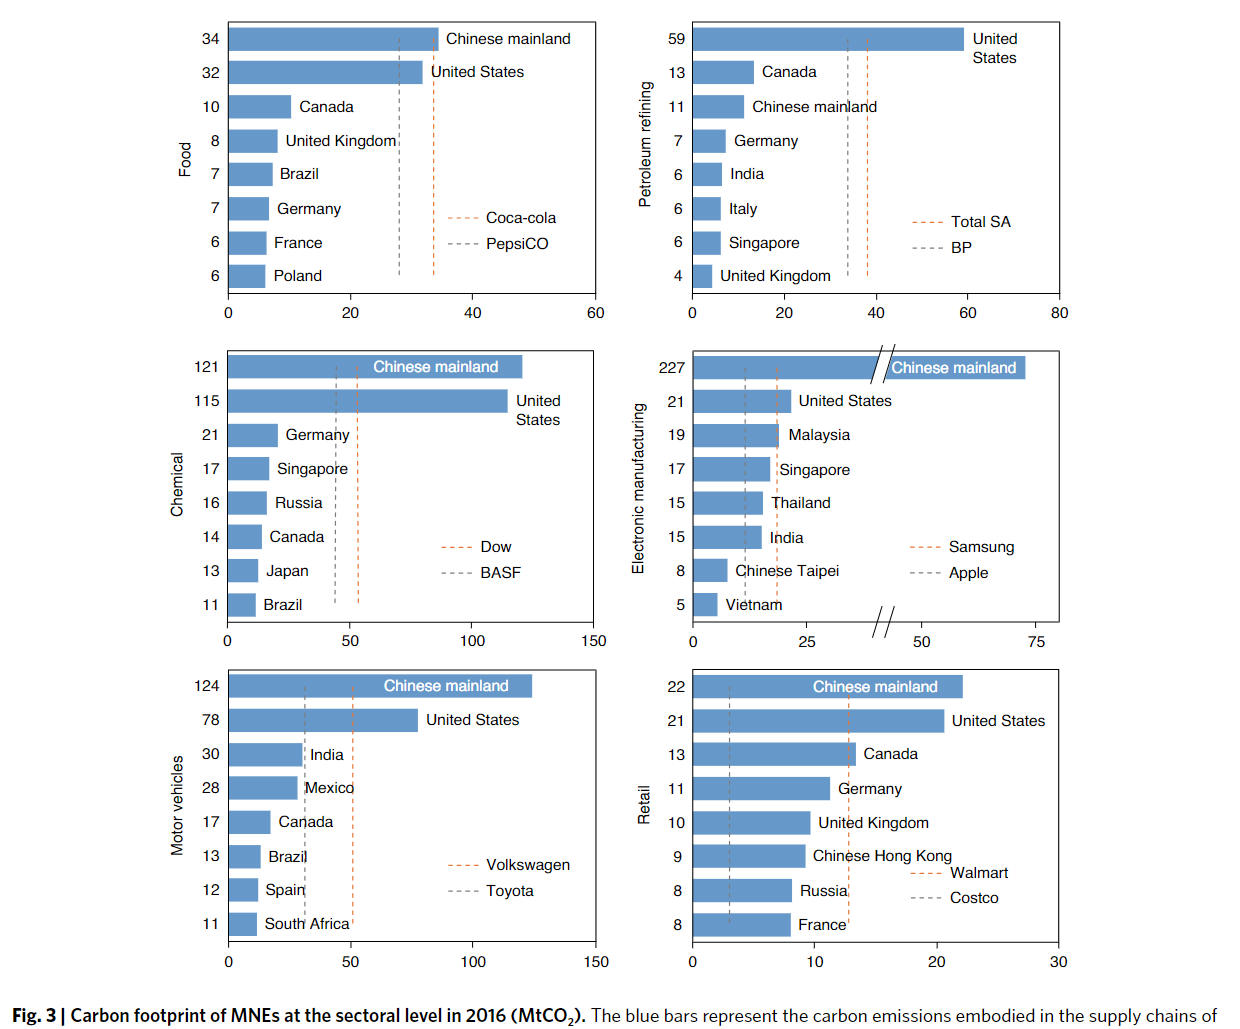
- Present a comprehensive study to trace carbon emissions embedied in the supply chains of global multinational enterprises (MNE)
Case:
Methodology:
- IO table: OECD
- FDI: OECD and US
- Carbon emission: IEA
Findings:
- Carbon footprint accounts for 18.7% of gloabl emissions
- The first peak happens in 2008. After the financial crisis, carbon footprints of MNE increased again and reached secondary and highest peak in 2011
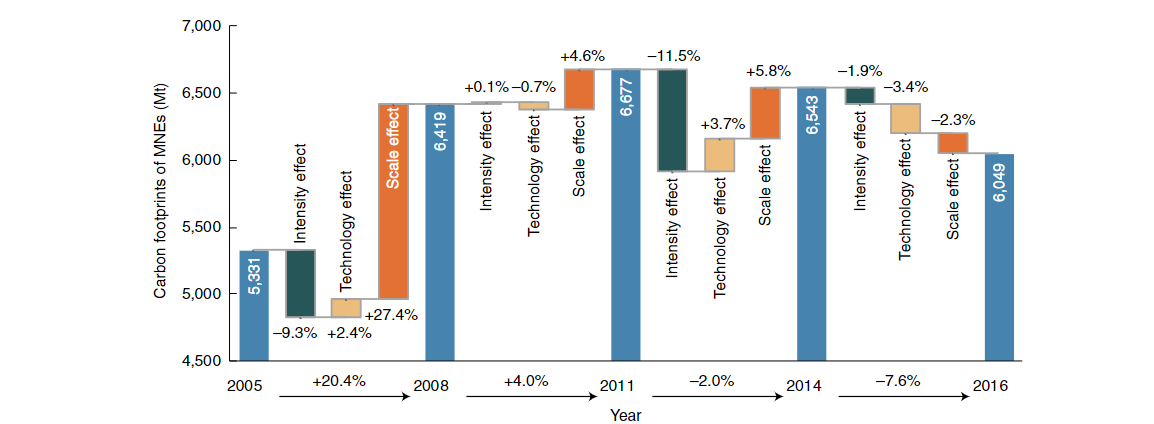
- The major contributor is the growth in the outputs of MNEs
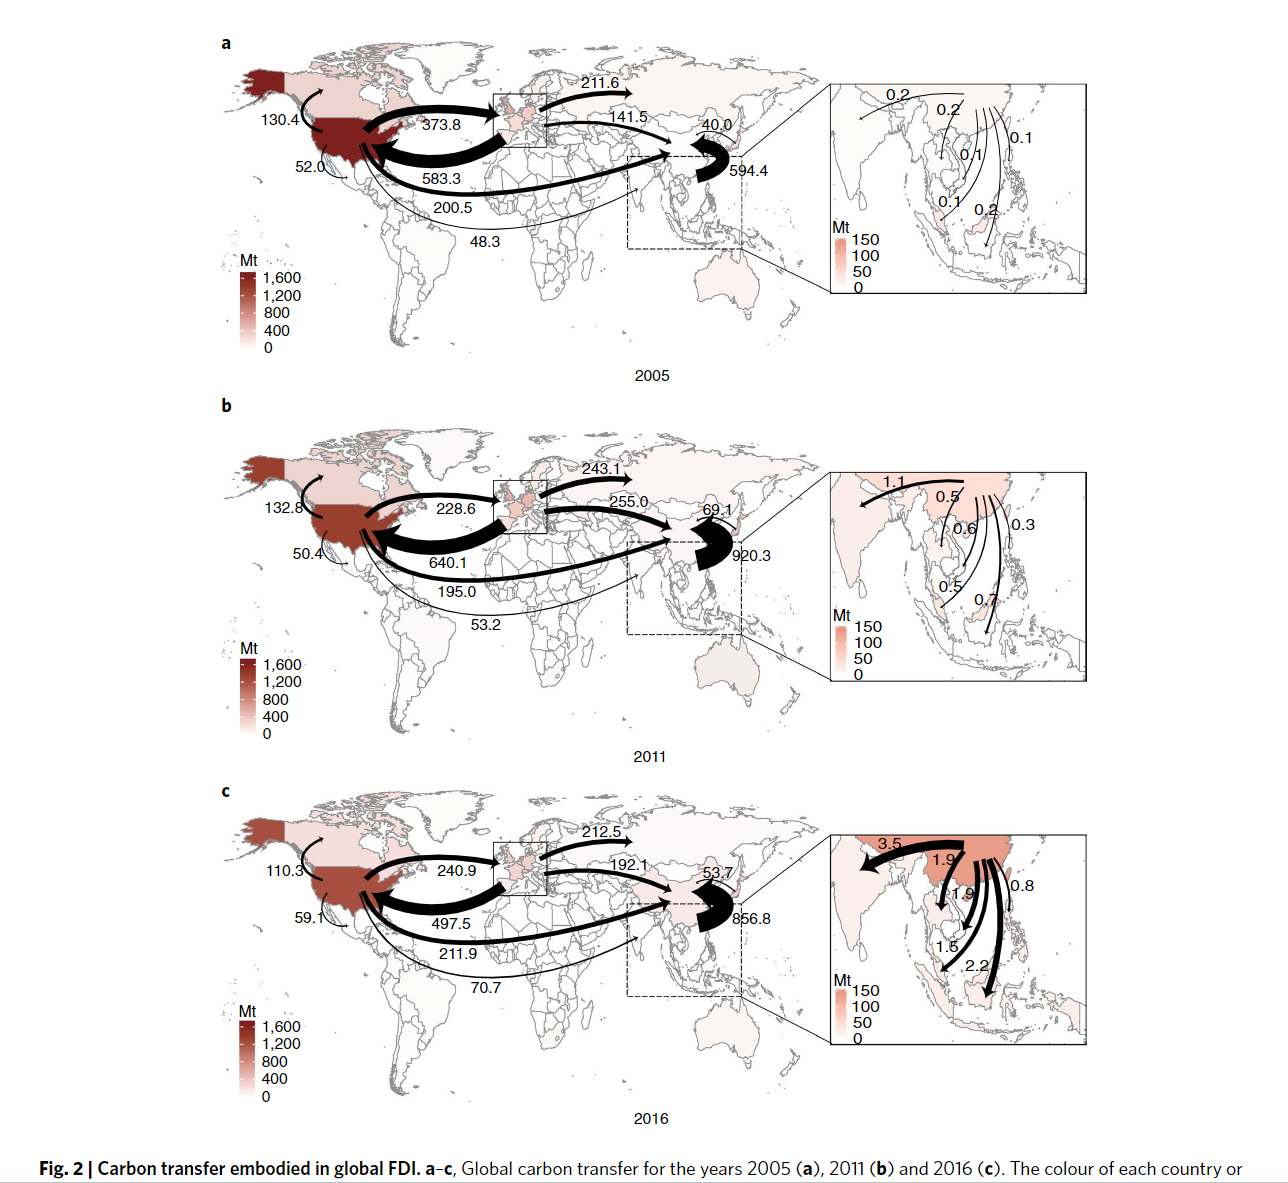
- China is the largest hosting region in 2016, followed by EU and US
- The largest carbon transfer through investment is from Chinese Hong Kong to mainland
- The volume of the carbon footprints of MNEs invested by developed countries was greater than the volume of their territorial emissions induced by foreign-owned enterprises, with the opposite findings for developing countries
- Chinese mainland has the largest net negative balance of embedied emissions in supply chains of MNEs
Coding Reference:
