Objective:
- Understand how implementing agencies can take advantage of the limited accessibility of monitoring technologies and whether there is any welfare consequences
Case:
Methodology:
Data Source
- Built-up
- Monitoring network
- Air quality: MODIS
- Industrial enterprises database
- Land and housing transaction
Findings:
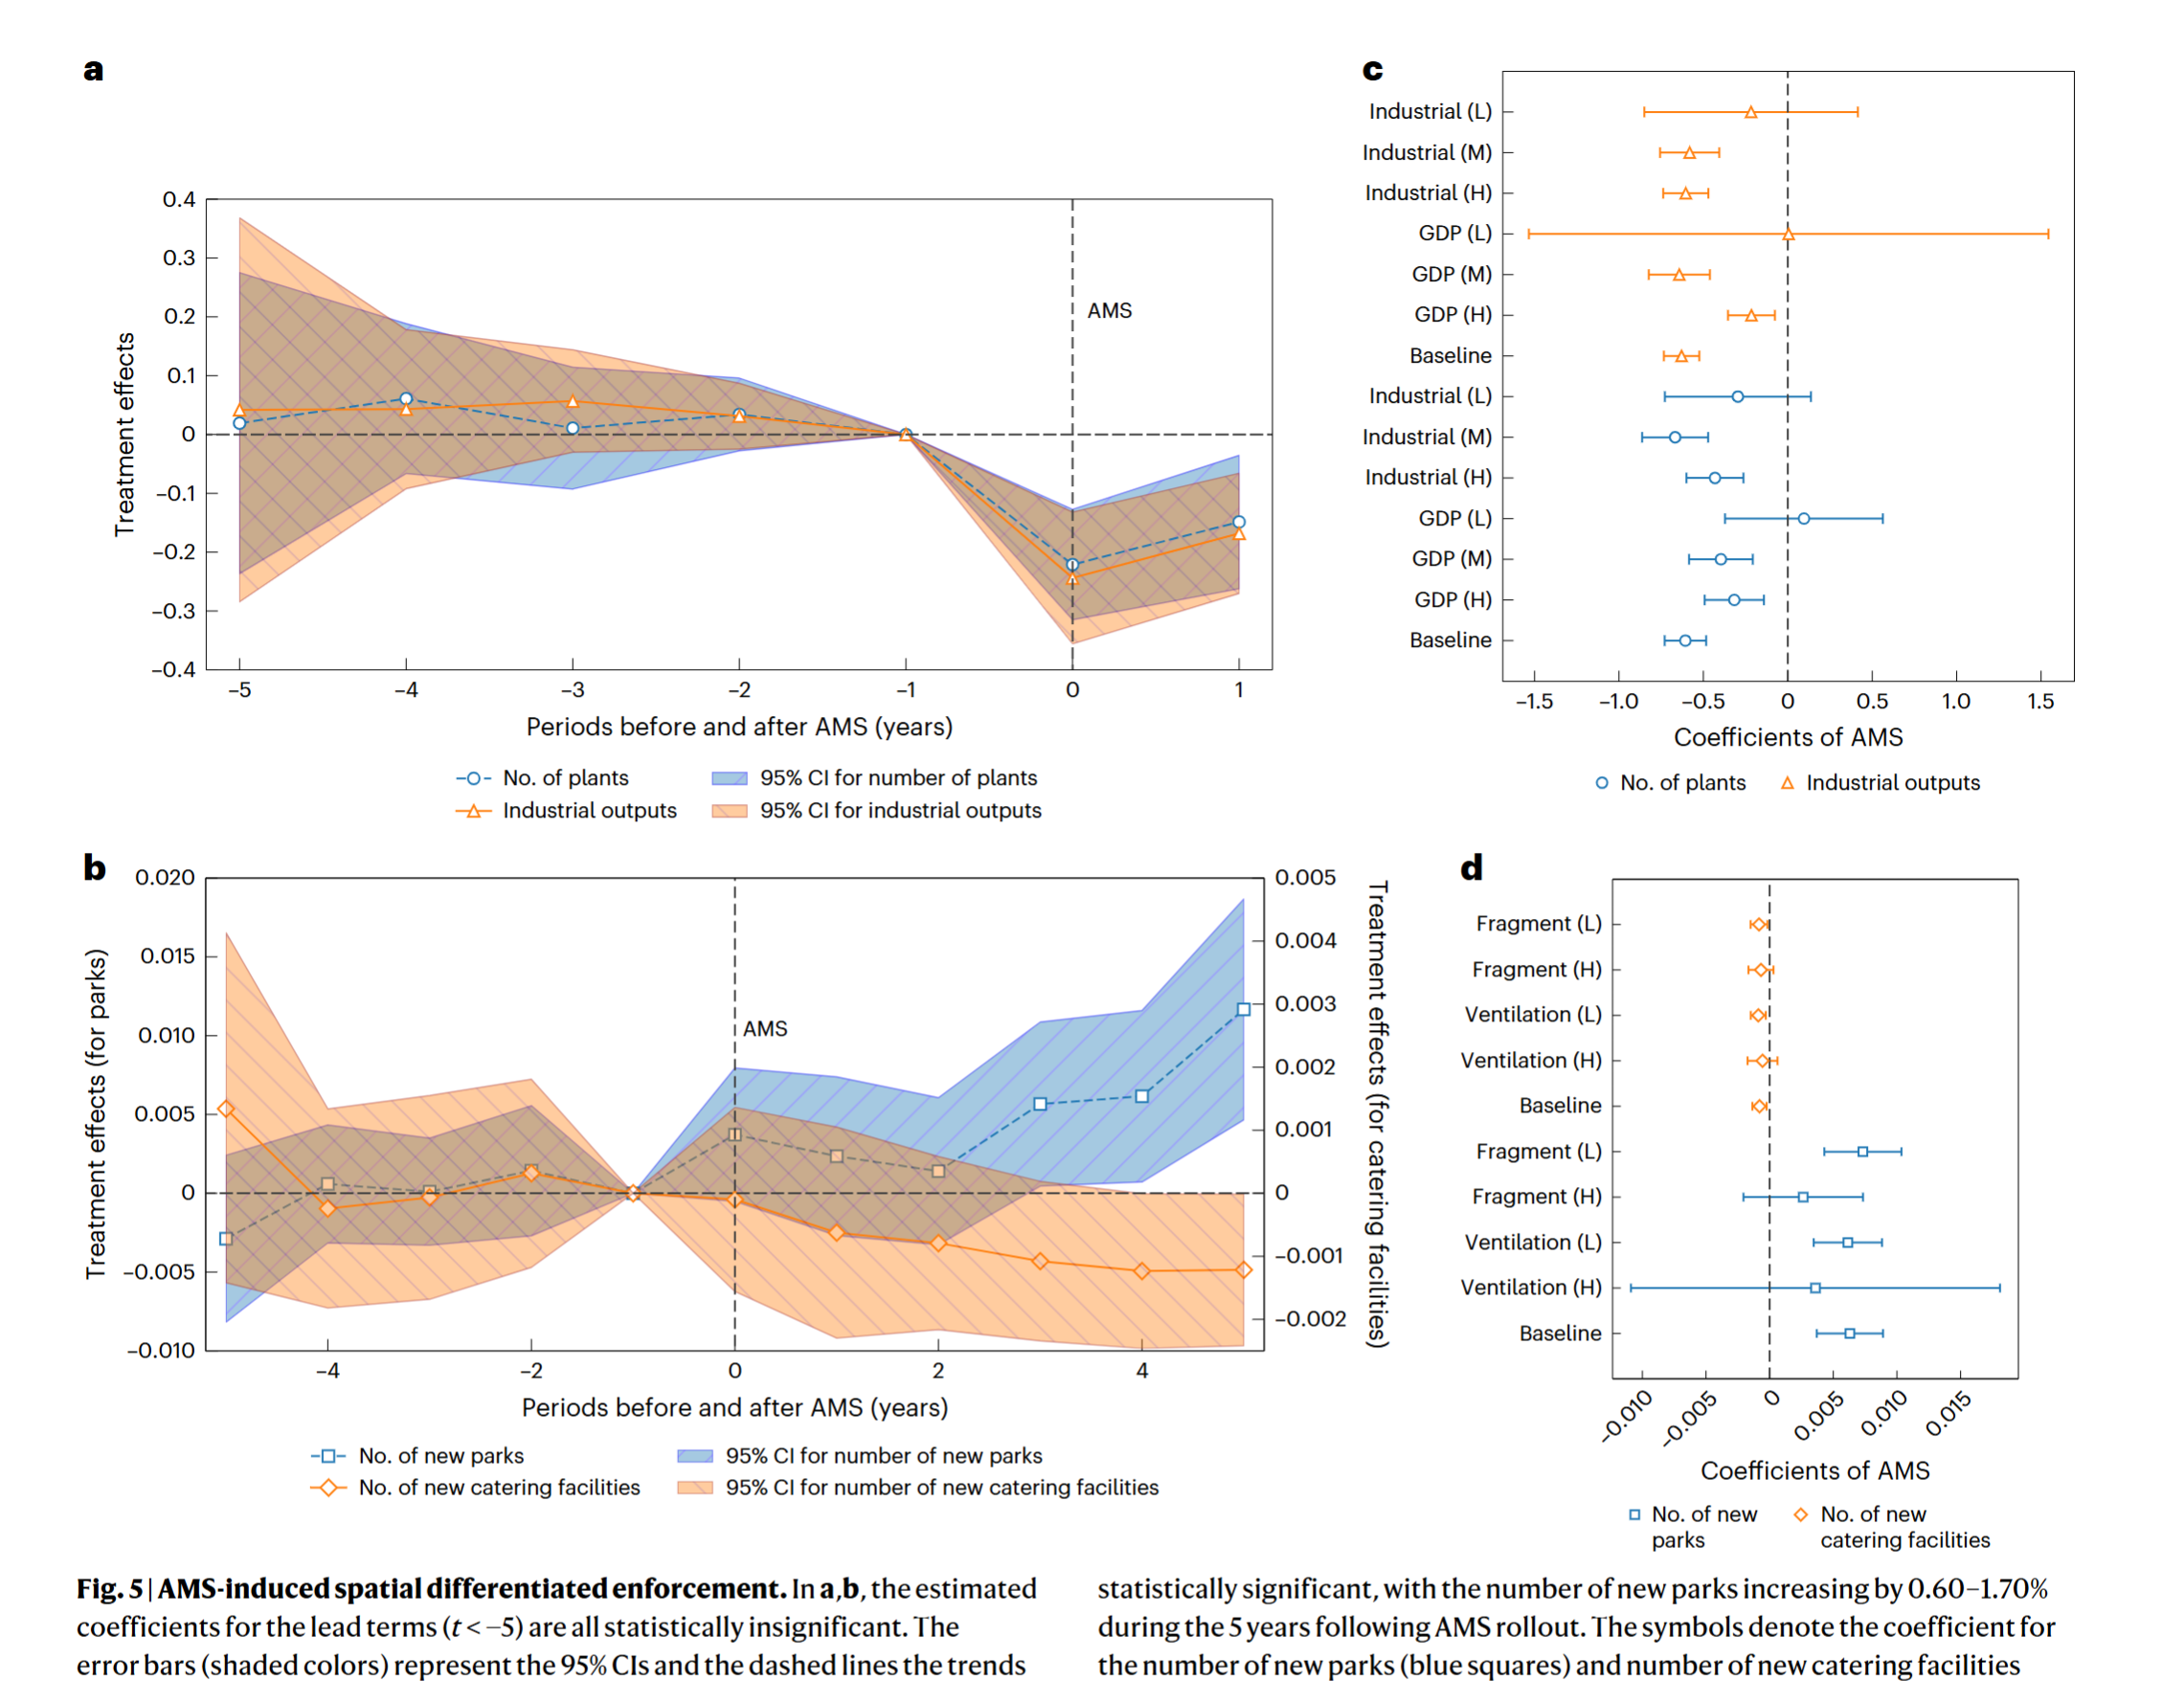
- A significant decline of 8.03% in monthly PM2.5
- The poorest 10% contributed marginally 5.4% to HANPP, 4.4% blue-water consumption and less than 3% to the other footprints
- On a per capita basis, the environmental impacts of the top 10% were 4.2 to 77 times that of the bottom 10%
- The consumption of the top 1% contributed 14% carbon emissions
Coding Reference:
