Objective:
- Estimate global urban built-up heights at a 500-m * 500-m grid level to characterize the distribution of infrastructure in urban areas
Case:
Methodology:
- Urban form: $QCD = \frac{Q_3 - Q_1}{Q_1 + Q_3}$
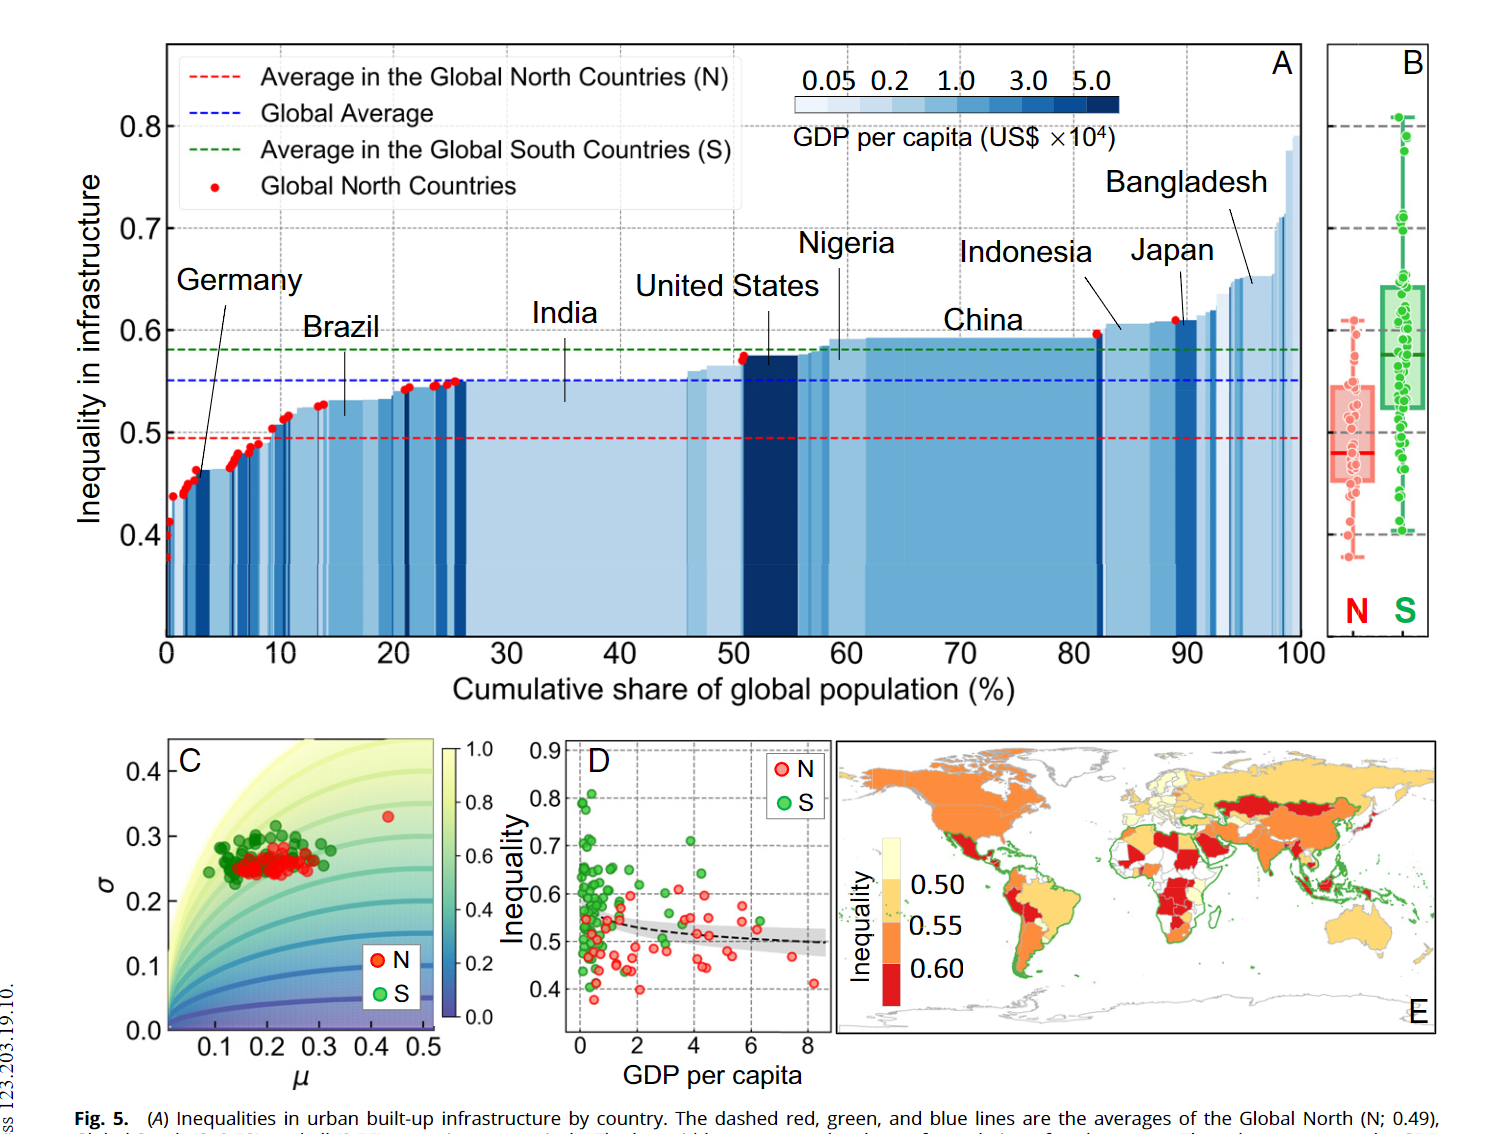
- Inequality: $I = \frac{\sigma}{(\mu(1-\mu))^{1/2}}$
Data Source
- Sentine-1
- Urban boundary: global urban boundary dataset
- Population and GDP: World Bank
Findings:
- Urban areas are dominated by low density and expansive development with low urban built-up heights
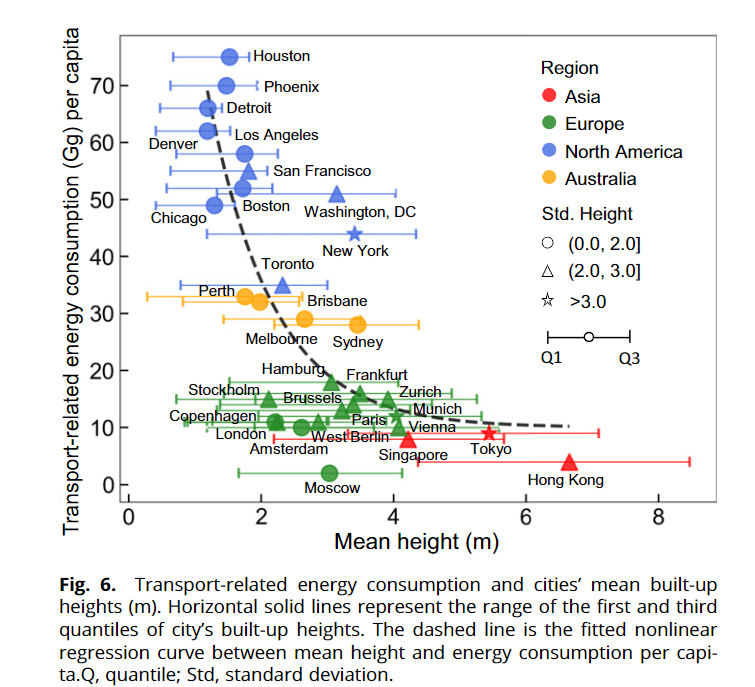
- Cities with high levels of verticality are predominantly located in East Asia and Western Europe
- Mean built-up height in China is two times higher than that in the US
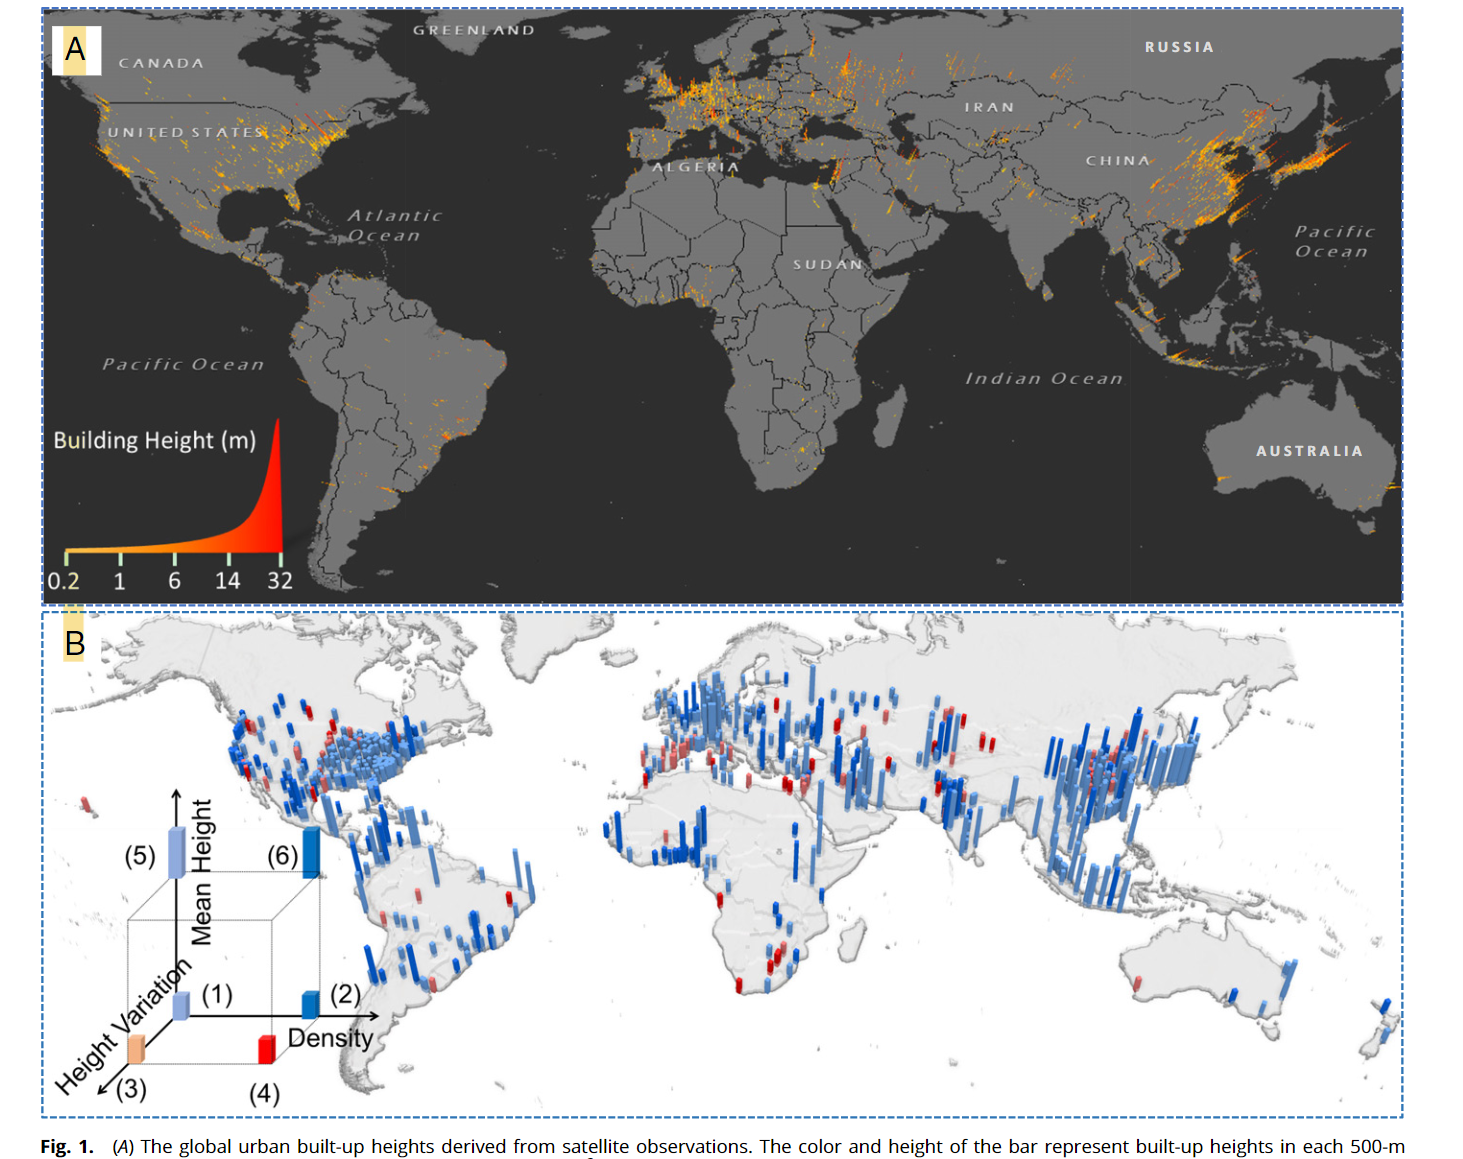
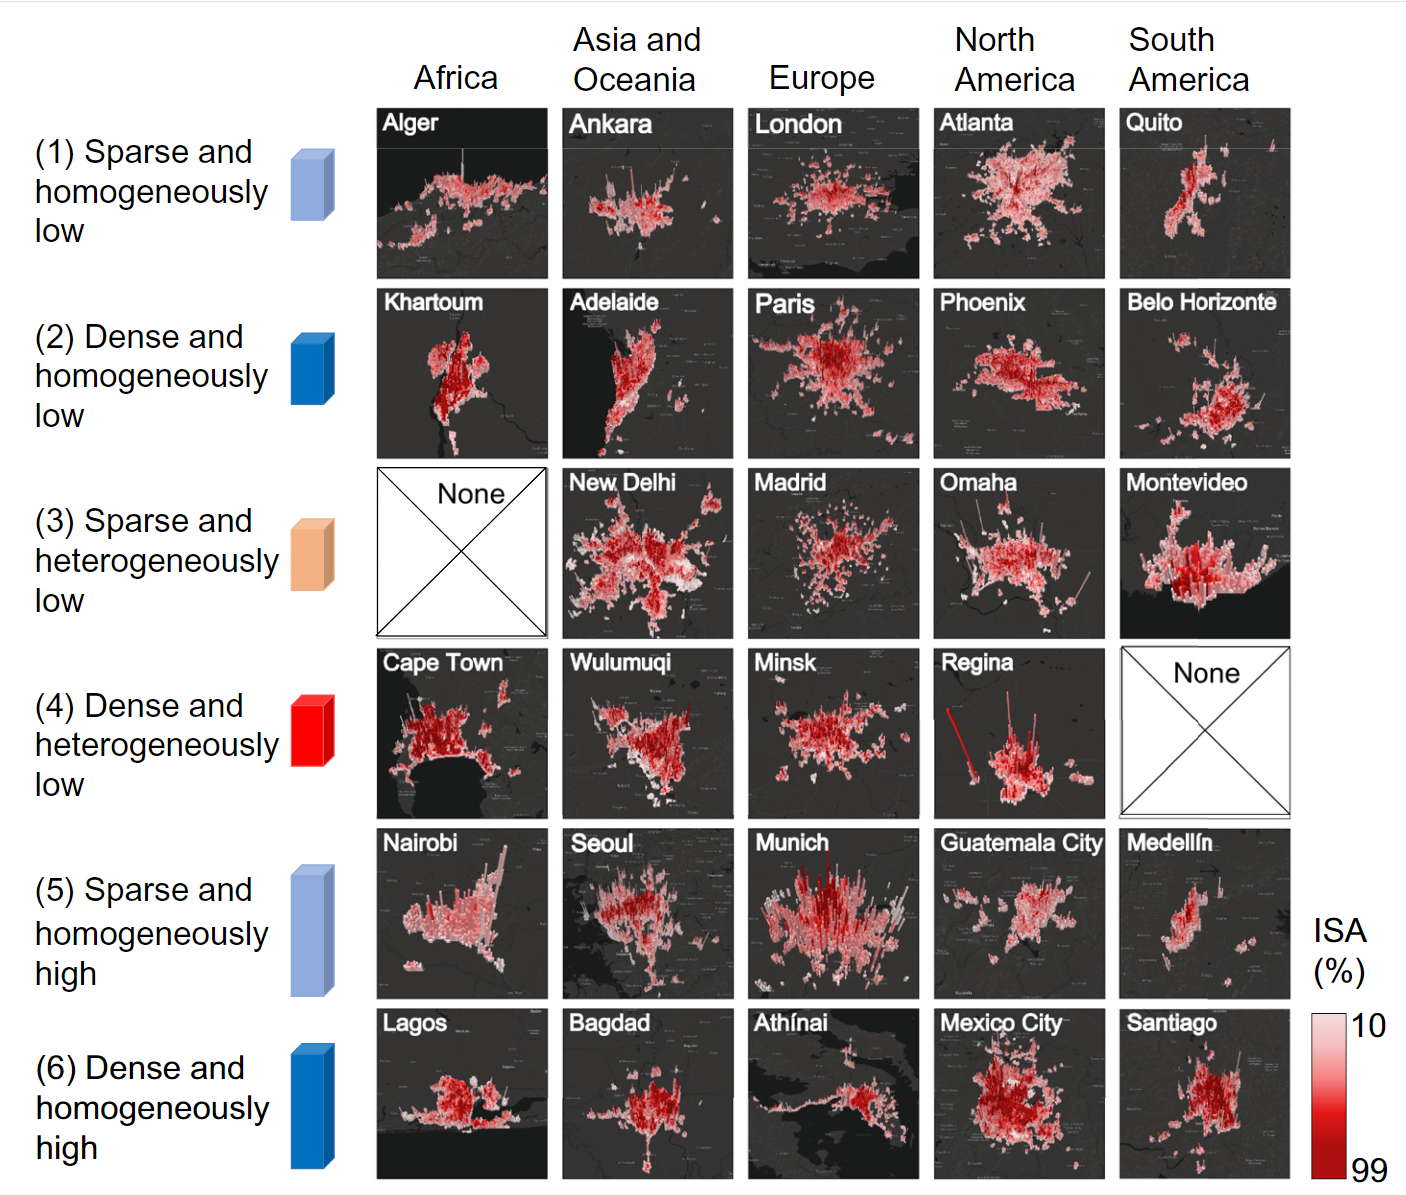
- Most cities have a distinct peak in built-up heights in the urban center, with declining heights from the center outward to surrounding areas
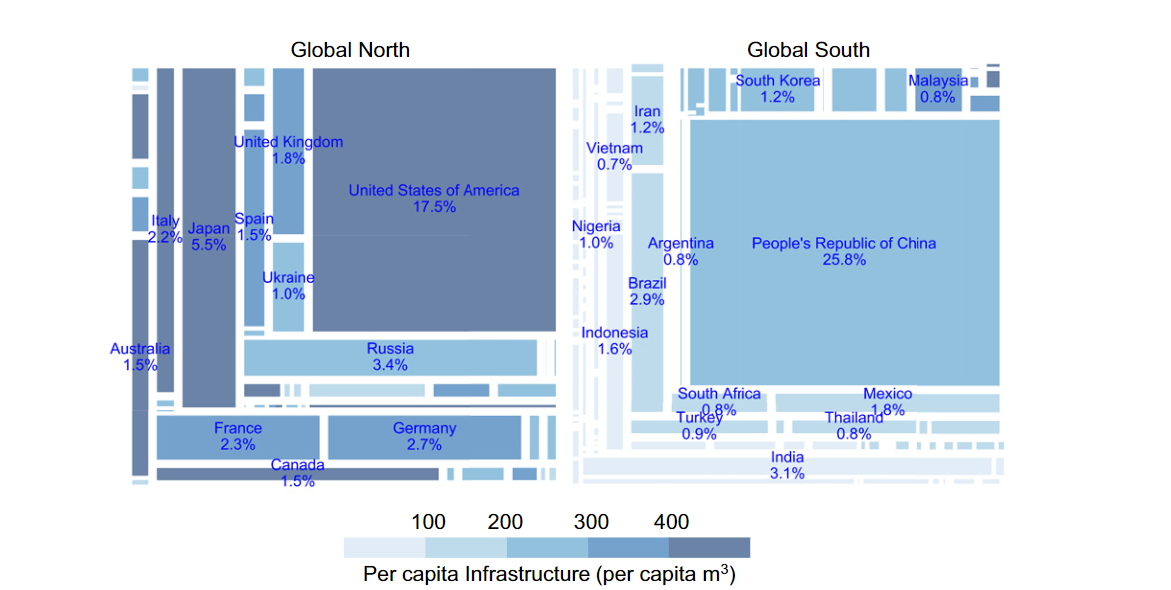
- Top three countries with the largest amount of urban built-up infrastructure, China, the US, Japan, account for ~50% of the global total
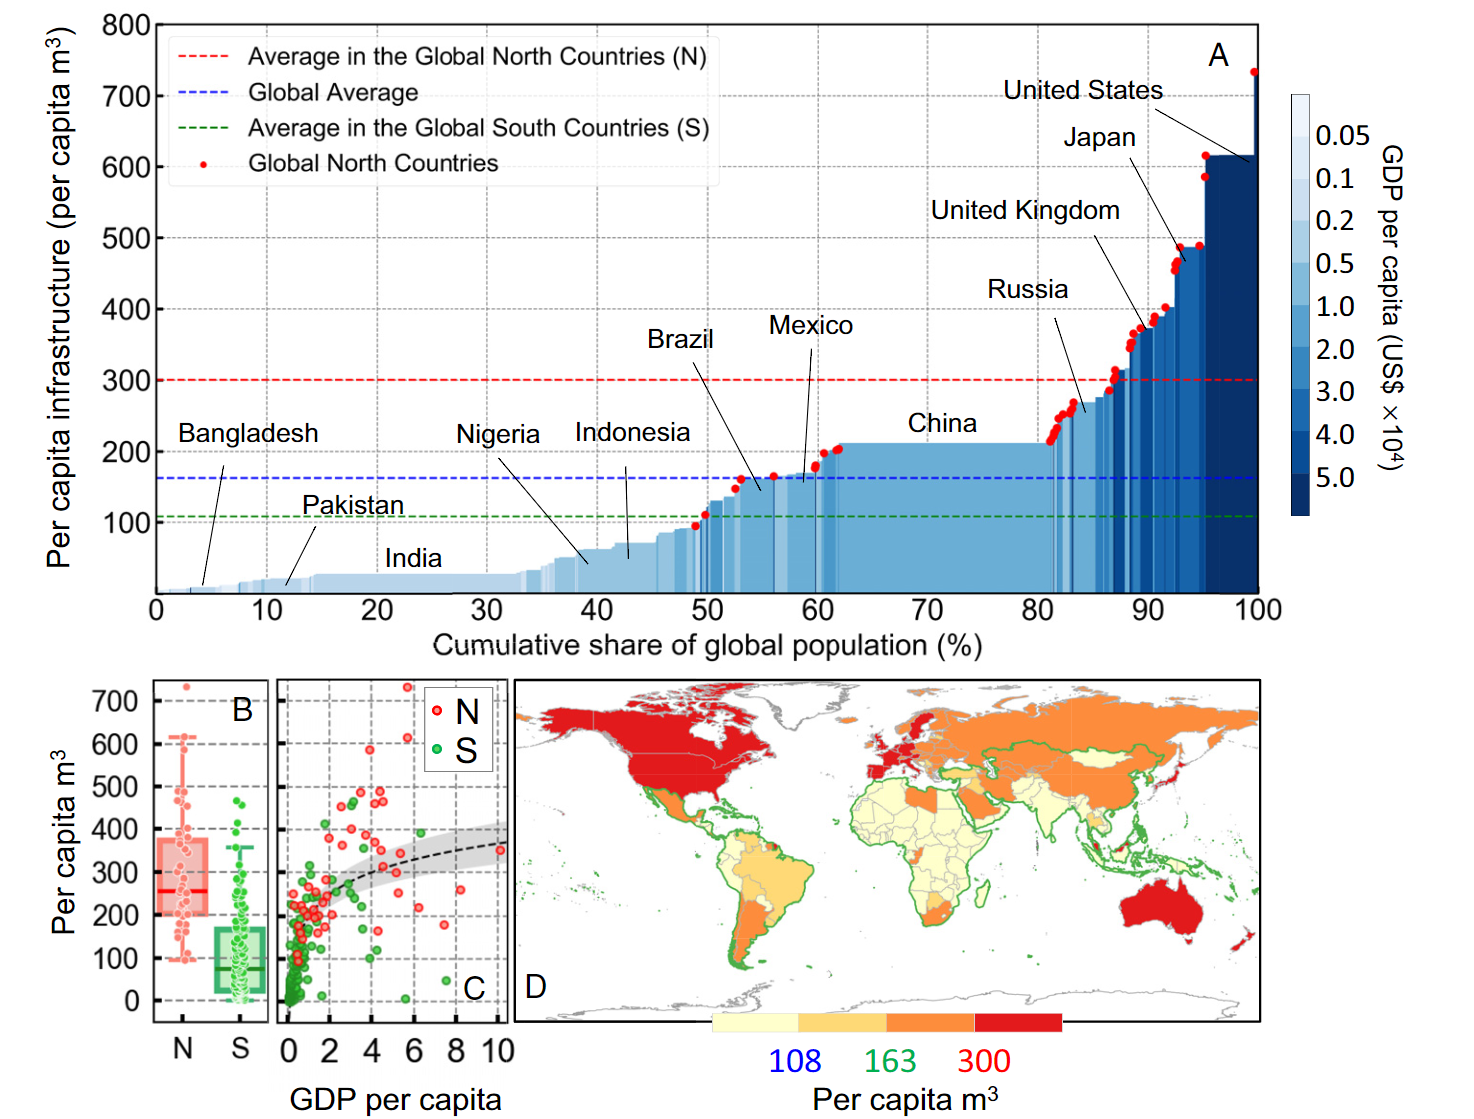
- Per capita infrastructure for ~90% of the global population is lower than the average level of the Global North
- Large inequalities in urban built-up infrastructrue
Coding Reference:
